
Description
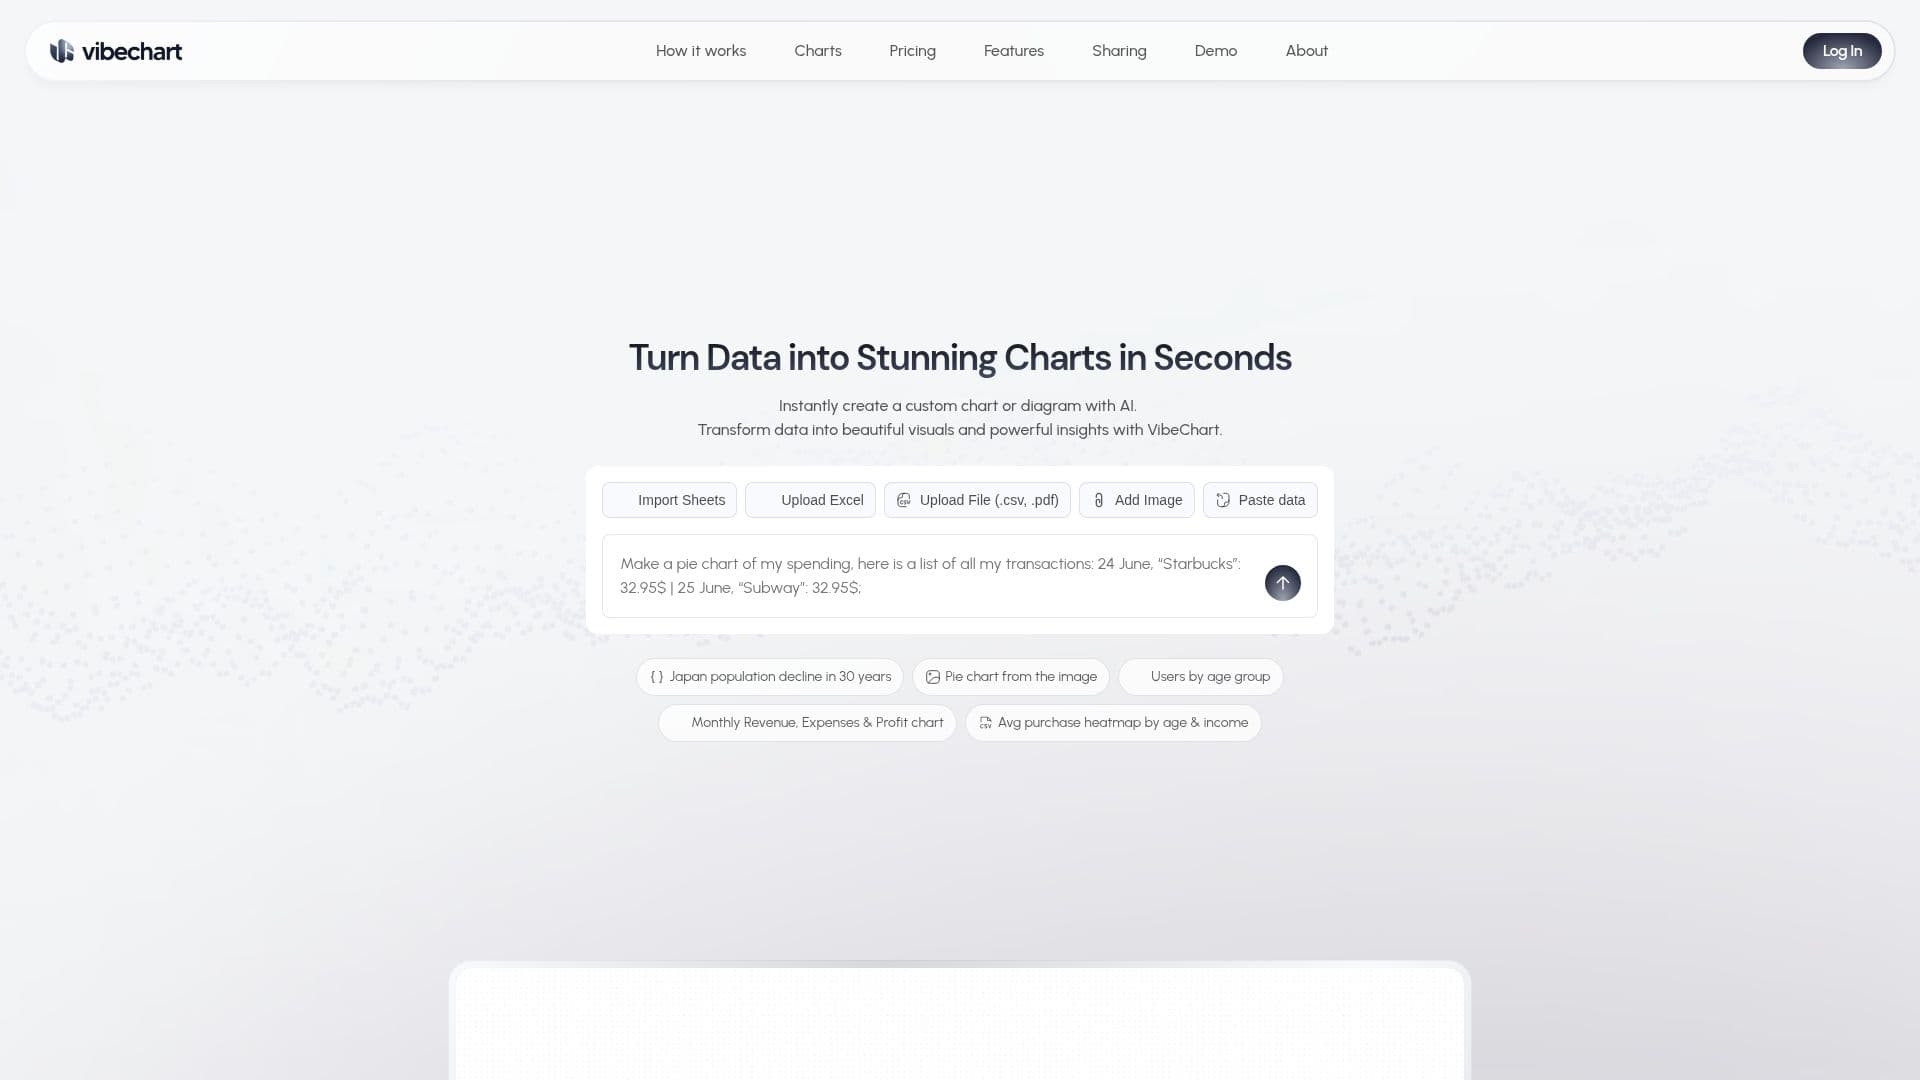
VibeChart is an AI-powered tool designed to transform data into visually appealing charts and diagrams quickly. It supports various data formats, including PDF, Excel, CSV, and plain text, making it versatile for different data sources. With VibeChart, users can create and customize over 40 types of charts using a text-to-chart interface, allowing for natural language and data queries.
The platform is built for speed, flexibility, and precision, making it a valuable asset for over 500 business and research teams. It includes a built-in data engineer feature that cleans, transforms, and extracts insights from messy data, providing users with smart, instructable tools to handle complex datasets.
VibeChart offers API and MCP access, ensuring high-speed and reliable chart generation with 99.9% uptime and sub-2-second response times. This makes it suitable for integration into various applications and workflows. Users can share their work effortlessly, exporting graphs as images, links, or embedded codes for platforms like PowerPoint, Notion, Slack, and more.
The pricing model includes a free tier with limited features, a Pro plan for unlimited chart creation, and an Enterprise plan for teams requiring advanced API access and priority support. VibeChart is ideal for data analytics, product management, surveys, consulting, accounting, investment, and quality assurance professionals looking to visualize data effectively.
Based in San Francisco, CA, the VibeChart team is dedicated to improving data visualization by constantly enhancing their models and adding smarter customization options. Their mission is to make data more human, accessible, and visual, inviting users to shape the future of data storytelling.
VibeChart's Core Features
Text-to-Chart interface
Over 40 chart types
Built-in data engineer
API & MCP access
99.9% uptime
Sub-2-second response time
Image, link, and embed exports
Supports PDF, Excel, CSV, plain text
How to use VibeChart?
Configure: Select data format and input
Use: Generate charts using text-to-chart interface
Share: Export charts as images, links, or embeds
Optimise: Use built-in data engineer for insights
VibeChart's Use Cases
- Data Analytics
- Product Management
- Surveys
- Consulting
- Accounting