
Description
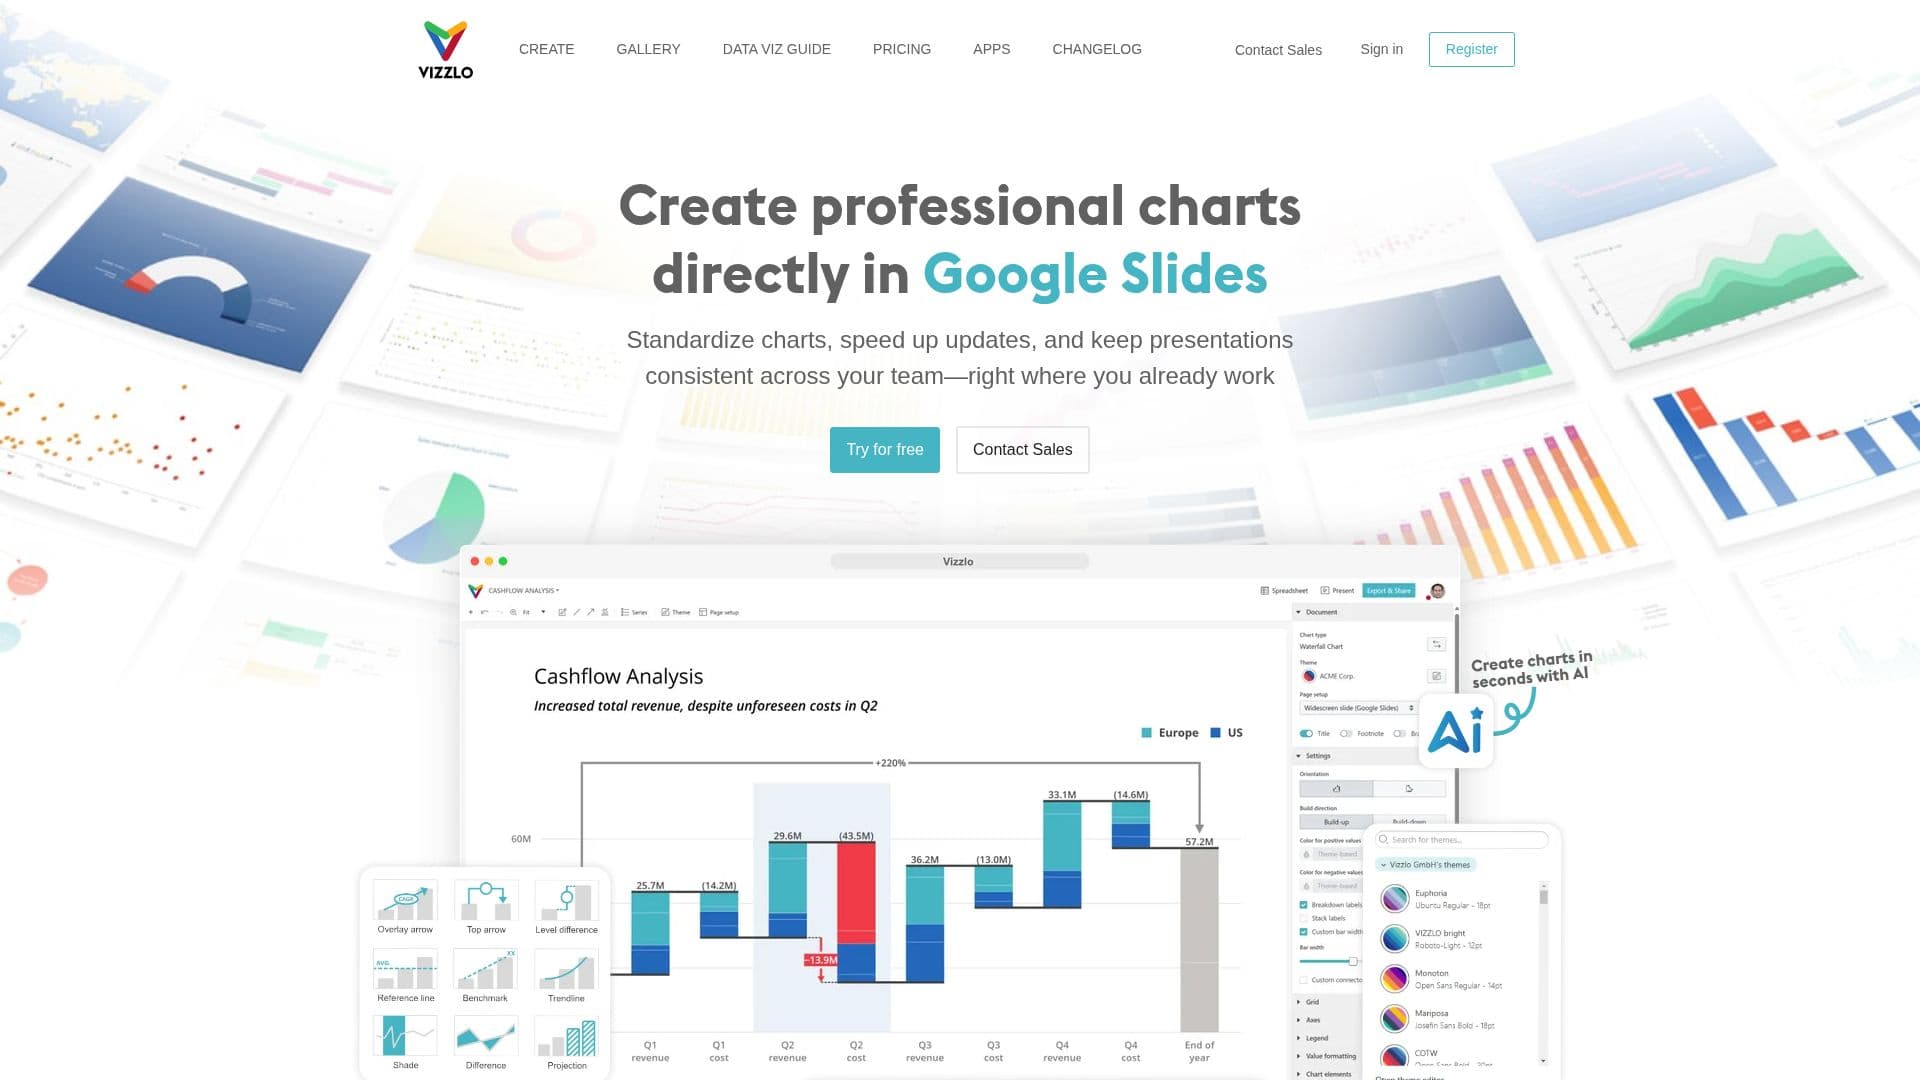
Vizzlo is a comprehensive tool designed to help professionals create high-quality charts and business graphics with ease. With over 120 chart types available, Vizzlo caters to a wide range of presentation needs, from project planning and roadmaps to performance tracking and reporting. Users can create and edit charts directly in Google Slides or PowerPoint, ensuring a seamless workflow without the need for additional tools or manual data transfers.
One of Vizzlo's standout features is its ability to maintain brand consistency across all visuals. Users can apply shared colors, fonts, and templates to ensure every chart aligns with their company's design standards. Additionally, Vizzlo offers advanced customization options, allowing users to highlight key insights with elements like arrows, projections, and reference lines.
Vizzlo supports integration with cloud storage services such as Google Drive, OneDrive, Dropbox, and Box, enabling users to connect charts to cloud files or public data sources for automatic updates. This ensures that any changes are reflected wherever the charts are used, keeping them always up-to-date.
For teams and enterprises, Vizzlo provides features like single sign-on (SSO), role-based access, centralized license management, and audit logs, making it a secure choice for team deployment. The platform also offers a free trial for 14 days, allowing users to explore its features before committing to a paid plan.
Vizzlo is available as a web application and desktop app for both Windows and macOS, supporting offline work and local file management. It is ideal for professionals such as consultants, project managers, marketers, analysts, and educators who need to create polished visuals quickly. The platform's AI assistant, Chart Vizzard, further enhances productivity by generating editable charts from user descriptions or data inputs.
Vizzlo Chart Creator's Core Features
120+ chart types
Google Slides integration
PowerPoint add-in
Cloud storage integration
Automatic data updates
Brand consistency tools
AI chart generation
Role-based access control
Single sign-on (SSO)
Audit logs
Offline desktop app
Free trial available
Customizable templates
Collaboration features
Data import from Excel/CSV
How to use Vizzlo Chart Creator?
Choose chart type: select from 120+ options
Add data: paste, upload, or connect
Customize: apply themes and annotations
Integrate: insert into Google Slides or PowerPoint
Collaborate: share and edit with team
Update: sync with cloud data sources
Export: save as PNG or PDF
Vizzlo Chart Creator's Use Cases
- Project Planning
- Performance Tracking
- Marketing Presentations
- Educational Materials
- Business Strategy
- Financial Analysis
- Market Analysis
- Sales Funnels
- Word Clouds
- Geographical Data