
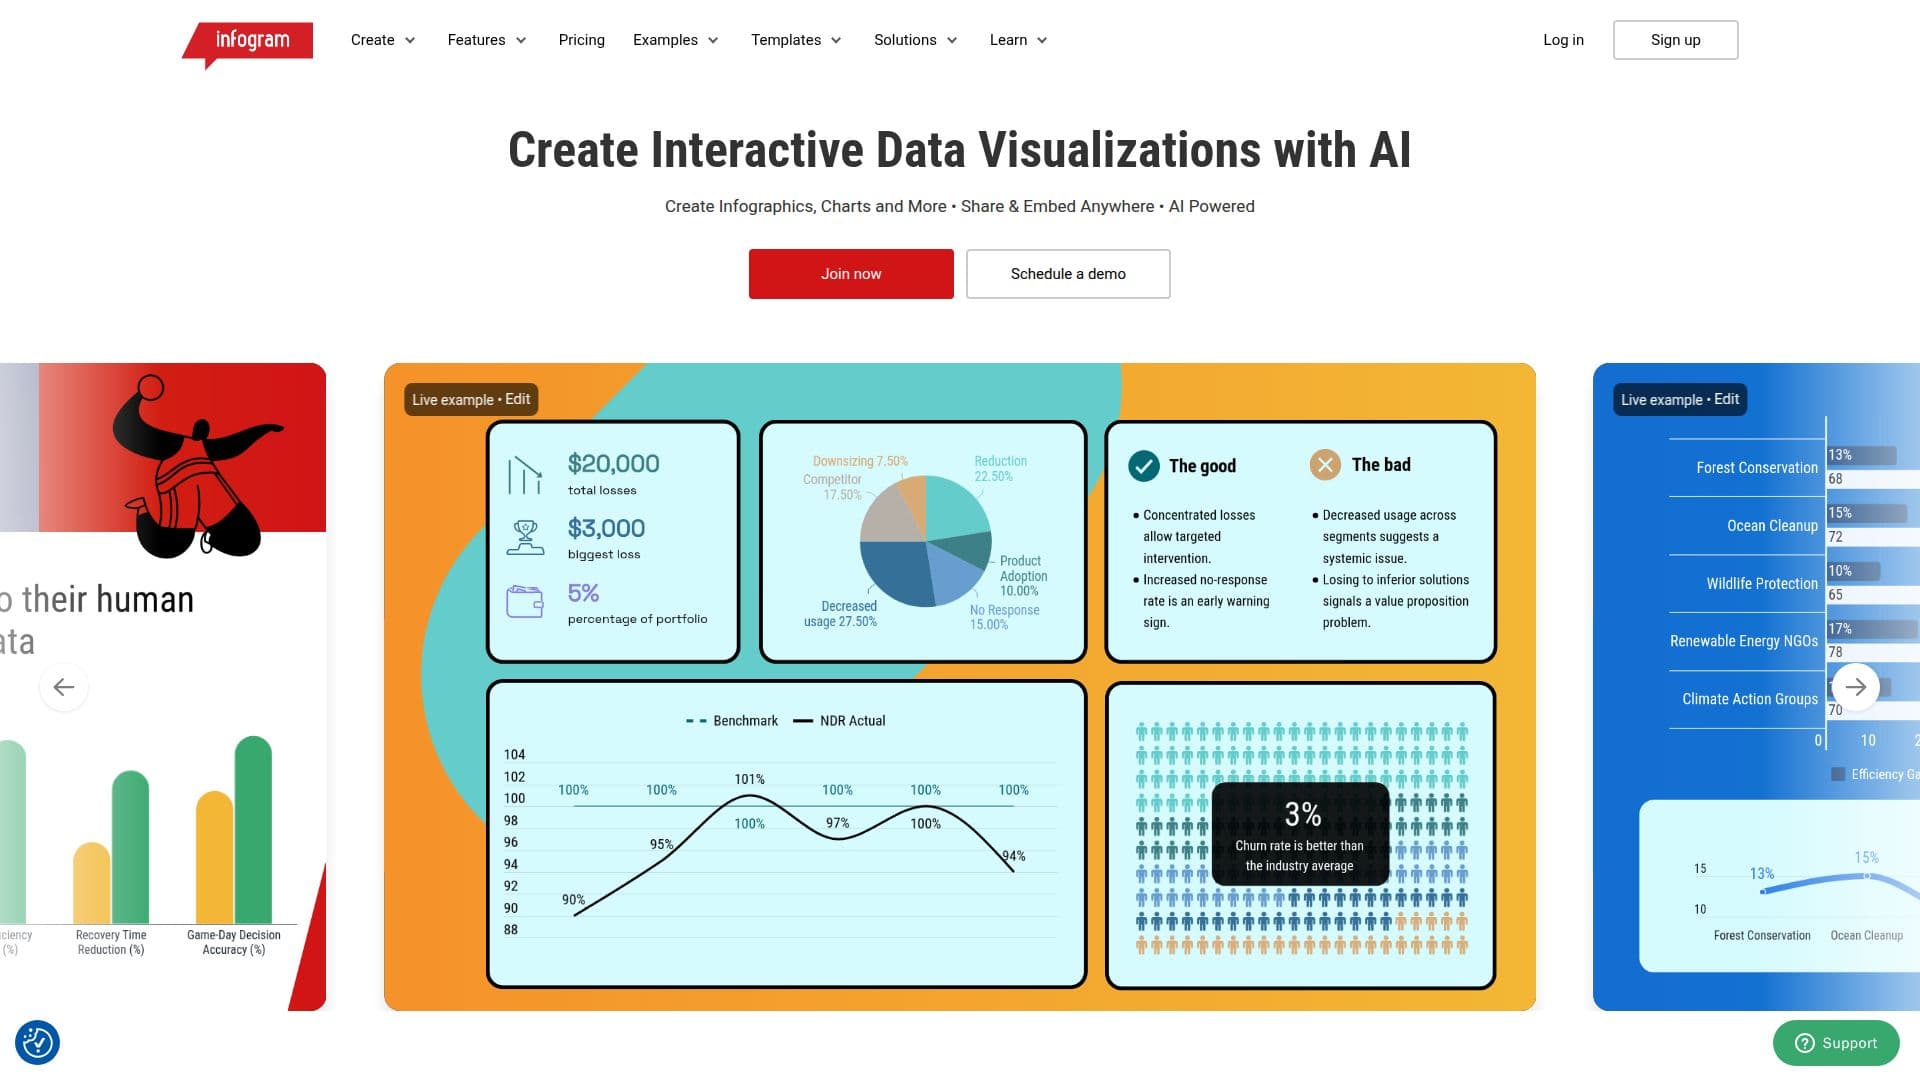
Description
Infogram empowers users to visualize and share data in minutes, transforming complex information into engaging stories. The platform is designed for anyone looking to create interactive data visualizations, whether for personal use, business presentations, or educational purposes. With Infogram, users can create a variety of visual content, including infographics, reports, and animated charts, all without needing advanced design skills.
Read More
The platform offers a user-friendly interface that allows users to easily select from a library of specialized charts and maps. Infogram's AI-powered features enhance the creation process, enabling users to generate professional-quality visualizations quickly. Users can also customize their projects with their own branding, including logos, colors, and fonts, ensuring consistency across all visual content.
Infogram is particularly beneficial for teams and organizations, providing collaborative tools that allow multiple users to work on projects simultaneously. This real-time collaboration feature, along with engagement analytics, helps teams streamline their workflows and improve productivity. Additionally, Infogram supports various integrations with popular applications like Google Drive, YouTube, and Dropbox, making data import seamless and efficient.
With flexible pricing plans, including a free tier, Infogram caters to a wide range of users, from individuals to large enterprises. The platform is trusted by over 30,000 companies worldwide, highlighting its effectiveness in enhancing data literacy and communication through visual storytelling. Whether you're a marketer, educator, or business professional, Infogram equips you with the tools needed to captivate your audience and convey your message effectively.
- CategoryData Visualization
- Pricing ModelFreemium
- DeploymentCloud
- PlatformsWeb
Infogram's Core Features
Interactive & Animated
Share & Embed Anywhere
Specialized Charts & Maps Library
AI-Powered Everything
Real-time Collaboration
Custom Branding Options
Engagement Analytics
Multiple User Access
Data Import from Various Sources
Privacy Control
Version History
Custom and Local Map Upload
How to use Infogram?
Choose a project type: Select from infographics, reports, or slides.
Pick a template: Use a pre-designed template or start from scratch.
Add data: Import data from sources like Google Drive or Excel.
Customize visuals: Adjust charts, maps, and other elements to fit your needs.
Add interactivity: Incorporate animations and interactive features.
Preview your project: Check how your visualization looks before publishing.
Share your work: Embed your project on websites or share via social media.
Infogram's Use Cases
- Marketing Presentations
- Educational Resources
- Business Reports
- Social Media Content
- Data Analysis