
ToolPotion
AI Advisor
Submit a Tool (Free)

Flourish

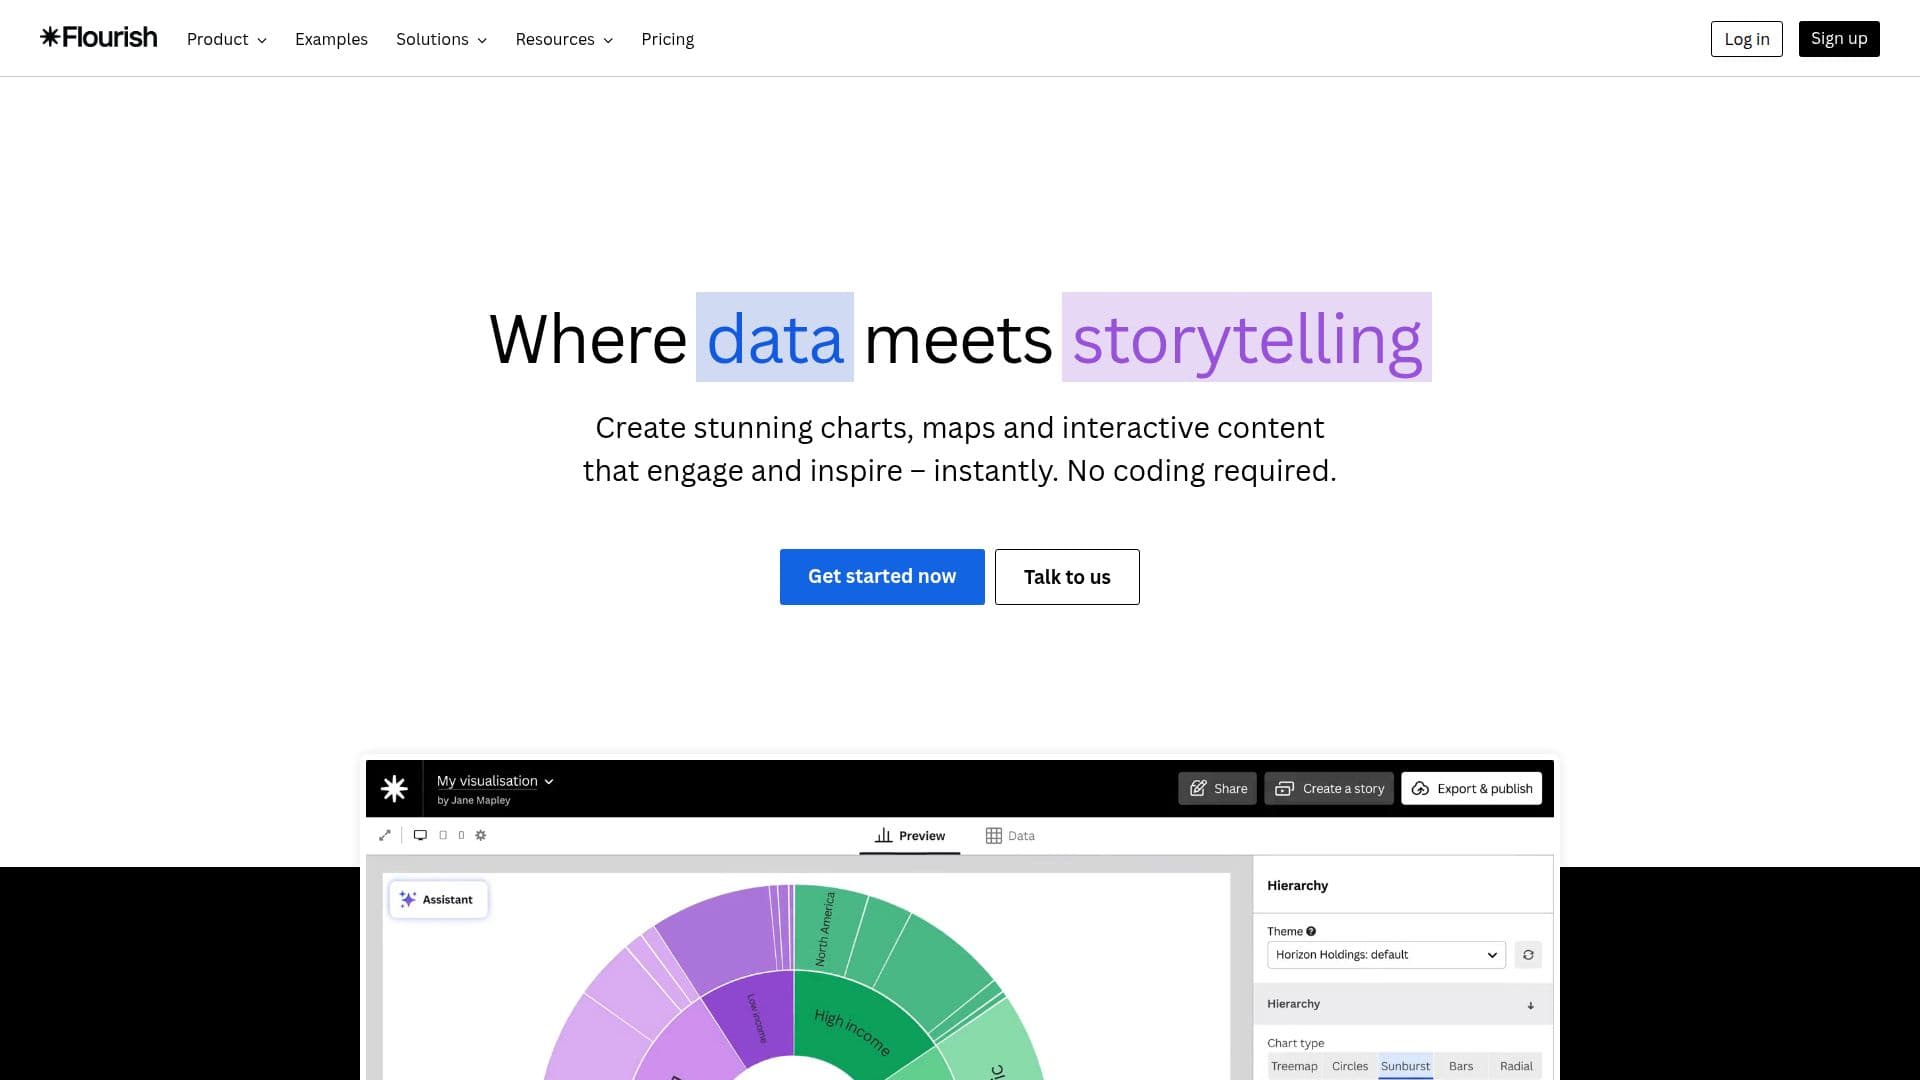
Flourish is a no-code data visualization platform that allows users to create stunning charts, maps, and interactive content. It empowers creators to tell compelling data stories with ease, making data engaging and accessible for all.

Visit Website
Share
Flourish screenshot
Flourish screenshot

Flourish is a powerful data visualization platform designed to help users bring their data to life through stunning visualizations and interactive content. With no coding required, Flourish allows anyone to create beautiful charts, maps, and presentations that engage and inspire audiences. The platform is trusted by organizations and newsrooms worldwide, enabling creators to transform complex data into compelling narratives that resonate with viewers.

Read More

Founded in 2018 by Duncan Clark and Robin Houston, Flourish has quickly gained recognition for its intuitive design and user-friendly interface. In 2022, Flourish was acquired by Canva, aligning with their mission to democratize data storytelling. This partnership enhances Flourish's capabilities, allowing users to seamlessly integrate interactive visualizations into their Canva designs, making it easier to create presentations and reports that stand out.

Flourish differentiates itself from other data visualization tools through its focus on storytelling features, such as scrollytelling and interactive presentations. Users can create immersive narratives that unfold as viewers scroll, guiding them through the data in an engaging manner. The platform also offers flexibility through the Flourish SDK, enabling developers to create custom templates tailored to their specific needs.

Security is a top priority for Flourish, which is ISO 27001-certified and employs robust measures to protect user data. Features like single sign-on (SSO), role-based permissions, and session control ensure that organizations can collaborate securely while maintaining control over their data.

Flourish is not just a tool for data visualization; it is a comprehensive solution for data storytelling. Whether for client pitches, reports, or digital publications, Flourish empowers users to create interactive visuals that captivate audiences and drive decisions. With a vast library of templates and extensive customization options, Flourish is ideal for teams looking to tell data stories across various platforms and formats.

  • CategoryData Visualization
  • Pricing ModelFreemium
  • DeploymentCloud
  • PlatformsWeb

  • No coding required

  • Interactive visualizations

  • Scrollytelling capabilities

  • Custom templates via Flourish SDK

  • Mobile-optimized outputs

  • Integration with Canva

  • Live data updates

  • Team collaboration features

  • Export options for images and HTML

  • Robust data privacy and security

  1. Choose a template: Select from a wide range of pre-designed templates.

  2. Upload data: Import your data into the chosen template.

  3. Customize visualization: Adjust colors, fonts, and styles to match your brand.

  4. Add interactivity: Use Flourish's tools to make your visualization interactive.

  5. Publish or embed: Share your visualization online or embed it in your website.

  6. Collaborate with team: Use shared folders and permissions for team projects.

  7. Export your work: Download your visualizations as images or HTML files.

  8. Integrate with Canva: Use Flourish visualizations in your Canva designs.

  • Client pitches
  • Data storytelling
  • Reports and publications
  • Educational content
  • Marketing campaigns

From Flourish

Flourish Reviews

Loading...

Popular AI Tools Like Flourish

Infogram

AI Apps

Infogram is an AI-powered platform that enables users to create interactive charts, maps, infographics, and reports. It allows for easy sharing and embedding, making data…

Data VisualizationMarketing & Creative Agencies

Ranked #16 in Data Visualization

View Tool

AI Apps

AI-powered platform that enables users to create interactive charts, maps, infographics, and reports. It allows for easy sharing and embedding, making data…Infogram is an AI-powered platform that enables users to create interactive charts, maps, infographics, and reports. It allows for easy sharing and embedding, making data…

Data VisualizationMarketing & Creative Agencies
Ranked #16 in Data Visualization

AI Graph Maker transforms text or data into interactive charts, mind maps, and knowledge graphs effortlessly. This free AI tool generates stunning visualizations in one click,…

Data Visualization

Ranked #227 for Data Analysts

View Tool

Transforms text or data into interactive charts, mind maps, and knowledge graphs effortlessly. This free AI tool generates stunning visualizations in one click,…AI Graph Maker transforms text or data into interactive charts, mind maps, and knowledge graphs effortlessly. This free AI tool generates stunning visualizations in one click,…

Data Visualization
Ranked #227 for Data Analysts

ChartAI

AI Apps

ChartAI is an AI-powered tool that generates stunning diagrams, charts, and visualizations. It simplifies the creation of visual assets for presentations, academic papers, and…

Data Visualization

Ranked #24 in Data Visualization

View Tool

AI Apps

AI-powered tool that generates stunning diagrams, charts, and visualizations. It simplifies the creation of visual assets for presentations, academic papers, and…ChartAI is an AI-powered tool that generates stunning diagrams, charts, and visualizations. It simplifies the creation of visual assets for presentations, academic papers, and…

Data Visualization
Ranked #24 in Data Visualization

Graphy

AI Apps

Graphy transforms messy data into beautiful, branded graphs and compelling stories with AI. It simplifies data presentation, enabling faster decisions and stronger team alignment.…

Data Visualization

Ranked #20 in Data Visualization

View Tool

AI Apps

Transforms messy data into beautiful, branded graphs and compelling stories with AI. It simplifies data presentation, enabling faster decisions and stronger team alignment.…Graphy transforms messy data into beautiful, branded graphs and compelling stories with AI. It simplifies data presentation, enabling faster decisions and stronger team alignment.…

Data Visualization
Ranked #20 in Data Visualization

VibeChart transforms data into shareable charts in seconds using AI. It supports various formats like PDF, Excel, CSV, and plain text, offering over 40 chart types. Ideal for…

Data Visualization
View Tool

Transforms data into shareable charts in seconds using AI. It supports various formats like PDF, Excel, CSV, and plain text, offering over 40 chart types. Ideal for…VibeChart transforms data into shareable charts in seconds using AI. It supports various formats like PDF, Excel, CSV, and plain text, offering over 40 chart types. Ideal for…

Data Visualization
See the Top 250 AI Apps

Vizzlo is a versatile tool for creating over 120 types of charts and business graphics. It integrates with Google Slides and PowerPoint, allowing users to generate professional…

Data Visualization
View Tool

Versatile tool for creating over 120 types of charts and business graphics. It integrates with Google Slides and PowerPoint, allowing users to generate professional…Vizzlo is a versatile tool for creating over 120 types of charts and business graphics. It integrates with Google Slides and PowerPoint, allowing users to generate professional…

Data Visualization
See the Top 250 AI Apps

MyLens

AI Apps

MyLens is a browser-based AI tool that turns documents, slides, spreadsheets, webpages, and YouTube links into narrated, interactive presentations. Users pick an AI agent and a…

AI Presentation Makers

Ranked #35 for Writing business proposals

View Tool

AI Apps

Browser-based AI tool that turns documents, slides, spreadsheets, webpages, and YouTube links into narrated, interactive presentations. Users pick an AI agent and a…MyLens is a browser-based AI tool that turns documents, slides, spreadsheets, webpages, and YouTube links into narrated, interactive presentations. Users pick an AI agent and a…

AI Presentation Makers
Ranked #35 for Writing business proposals

PicDoc

AI Apps

PicDoc is an AI-powered tool that transforms complex text into clear visualizations. It supports creating diagrams, charts, and infographics for research, education, and…

Data Visualization

Ranked #171 for Writers

View Tool

AI Apps

AI-powered tool that transforms complex text into clear visualizations. It supports creating diagrams, charts, and infographics for research, education, and…PicDoc is an AI-powered tool that transforms complex text into clear visualizations. It supports creating diagrams, charts, and infographics for research, education, and…

Data Visualization
Ranked #171 for Writers
1 of 8