ToolPotion
AI Advisor
Submit a Tool (Free)

Graphy

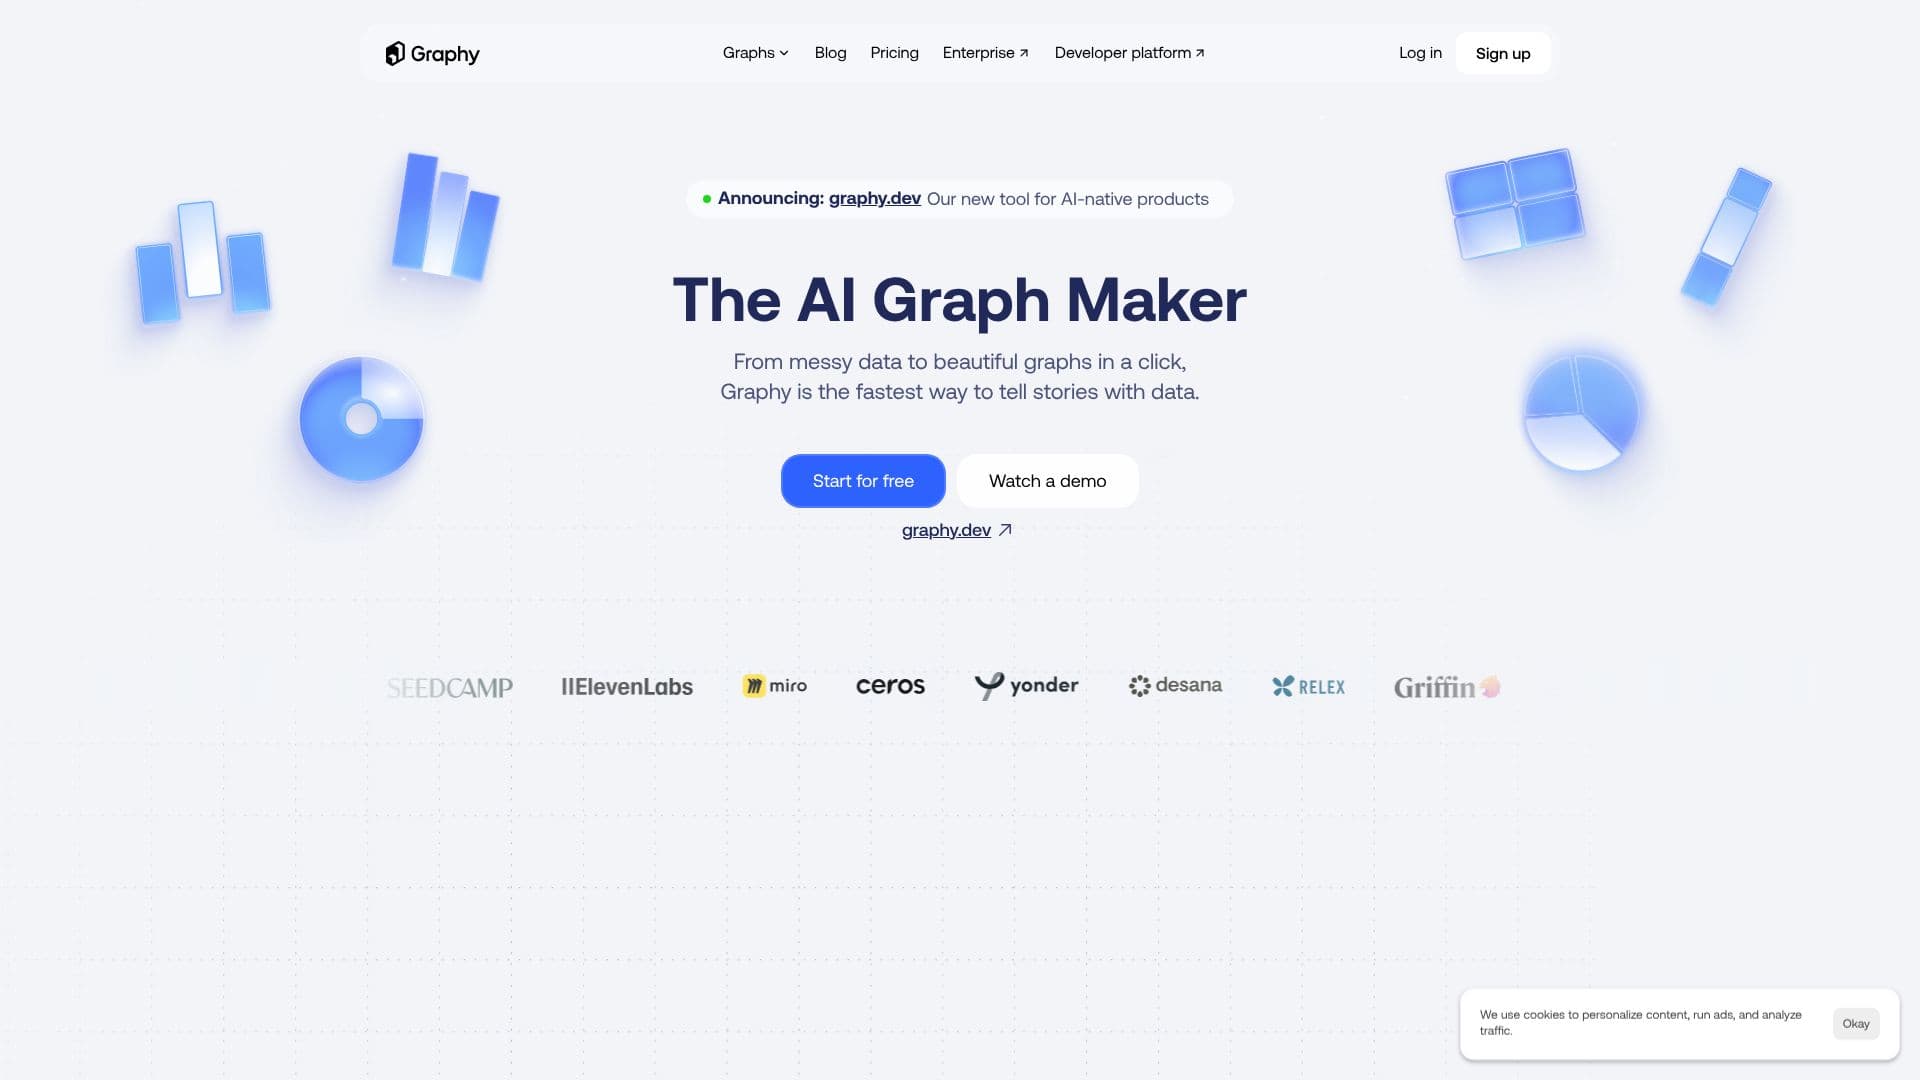
Graphy transforms messy data into beautiful, branded graphs and compelling stories with AI. It simplifies data presentation, enabling faster decisions and stronger team alignment. Connect data sources, let AI highlight insights, and export or embed visuals for presentations, social media, and documentation.

Visit Website
Share
Graphy screenshot
Graphy screenshot

Graphy is an AI-powered tool designed to radically simplify the way data is presented and communicated, enabling anyone to become a skilled data storyteller. It transforms raw, messy data into beautiful, branded graphs and insightful narratives with just a click.

Read More

The platform streamlines the entire process of data visualization and storytelling. Users can start by adding their data through various methods: linking live Google Sheets, uploading CSV or Excel files, pasting or typing values, calling an API, or even asking AI to search for data. Graphy ingests all data without requiring pre-formatting or preparation.

Once data is added, Graphy's AI engine analyzes the dataset, highlighting the most important insights. Users can interact with their data through chat, quickly getting the right chart, insight, or answer. The tool allows for instant branding of charts with custom colors and fonts, and annotations can be used to emphasize key findings.

The ultimate goal of Graphy is to help users tell their data stories effectively. The generated visuals can be exported or embedded directly into various formats, including slides for presentations, social posts, documentation, and internal updates. This ensures that data-driven insights are communicated clearly and impactfully, leading to actionable outcomes, fewer meetings, faster decisions, and stronger team alignment.

Graphy is trusted by over 300,000 data storytellers and is praised for its ability to create stunning visuals from disparate sources with context and commentary. It's particularly beneficial for those who find traditional data tools cumbersome or time-consuming, offering a faster, more intuitive way to work with data and communicate its value.

  • CategoryData Visualization
  • Pricing ModelFreemium
  • DeploymentCloud
  • PlatformsWeb

  • AI-powered data analysis and insight highlighting

  • Multiple data input methods: Google Sheets, CSV, Excel, API, manual entry

  • Instant chart branding with custom colors and fonts

  • Annotation tools to emphasize key data points

  • Export and embed options for various platforms

  • Chat interface for querying data and generating insights

  • Automated graph generation from messy data

  • Supports creating slides, social posts, and documentation visuals

  • Live data updates for dashboards

  • Transforms data into compelling stories

  • Simplifies data presentation and communication

  1. Add your data: Link a Google Sheet, upload a file, paste values, or use the API.

  2. Let AI work: Graphy analyzes your data and highlights key insights.

  3. Chat with your data: Get charts, answers, or insights instantly.

  4. Make your data shine: Brand charts with your colors and fonts, add annotations.

  5. Tell your story: Export or embed your visuals for presentations, social media, or docs.

  • Data Storytelling
  • Marketing Reports
  • Social Media Content
  • Business Presentations
  • Internal Documentation
  • Product Analytics
  • Financial Reporting

Graphy Reviews

Loading...

Popular AI Tools Like Graphy

AI Graph Maker transforms text or data into interactive charts, mind maps, and knowledge graphs effortlessly. This free AI tool generates stunning visualizations in one click,…

Data Visualization

Ranked #224 for Data Analysts

View Tool

Transforms text or data into interactive charts, mind maps, and knowledge graphs effortlessly. This free AI tool generates stunning visualizations in one click,…AI Graph Maker transforms text or data into interactive charts, mind maps, and knowledge graphs effortlessly. This free AI tool generates stunning visualizations in one click,…

Data Visualization
Ranked #224 for Data Analysts

VibeChart transforms data into shareable charts in seconds using AI. It supports various formats like PDF, Excel, CSV, and plain text, offering over 40 chart types. Ideal for…

Data Visualization
View Tool

Transforms data into shareable charts in seconds using AI. It supports various formats like PDF, Excel, CSV, and plain text, offering over 40 chart types. Ideal for…VibeChart transforms data into shareable charts in seconds using AI. It supports various formats like PDF, Excel, CSV, and plain text, offering over 40 chart types. Ideal for…

Data Visualization
See the Top 250 AI Apps

ChartPixel offers instant AI-driven data analysis, generating interactive charts and actionable insights from messy data. It simplifies data cleaning, visualization, and…

AI Data Analysis

Ranked #74 for Cleaning & formatting data

View Tool

Offers instant AI-driven data analysis, generating interactive charts and actionable insights from messy data. It simplifies data cleaning, visualization, and…ChartPixel offers instant AI-driven data analysis, generating interactive charts and actionable insights from messy data. It simplifies data cleaning, visualization, and…

AI Data Analysis
Ranked #74 for Cleaning & formatting data

Infogram

AI Apps

Infogram is an AI-powered platform that enables users to create interactive charts, maps, infographics, and reports. It allows for easy sharing and embedding, making data…

Data VisualizationMarketing & Creative Agencies

Ranked #16 in Data Visualization

View Tool

AI Apps

AI-powered platform that enables users to create interactive charts, maps, infographics, and reports. It allows for easy sharing and embedding, making data…Infogram is an AI-powered platform that enables users to create interactive charts, maps, infographics, and reports. It allows for easy sharing and embedding, making data…

Data VisualizationMarketing & Creative Agencies
Ranked #16 in Data Visualization

Tableau

AI Apps

Tableau is a powerful business intelligence and analytics software that helps users visualize and understand their data. It connects to various databases, enabling users to create…

Data VisualizationHealthcare & Life Sciences
View Tool

AI Apps

Powerful business intelligence and analytics software that helps users visualize and understand their data. It connects to various databases, enabling users to create…Tableau is a powerful business intelligence and analytics software that helps users visualize and understand their data. It connects to various databases, enabling users to create…

Data VisualizationHealthcare & Life Sciences
See the Top 250 AI Apps

Vizzy is an AI-powered tool that simplifies data visualization by connecting to OpenAI's LLMs. Users can upload data files and receive visualizations, with an emphasis on rapid…

Data Visualization
View Tool

AI-powered tool that simplifies data visualization by connecting to OpenAI's LLMs. Users can upload data files and receive visualizations, with an emphasis on rapid…Vizzy is an AI-powered tool that simplifies data visualization by connecting to OpenAI's LLMs. Users can upload data files and receive visualizations, with an emphasis on rapid…

Data Visualization
See the Top 250 AI Apps

ChartAI

AI Apps

ChartAI is an AI-powered tool that generates stunning diagrams, charts, and visualizations. It simplifies the creation of visual assets for presentations, academic papers, and…

Data Visualization

Ranked #24 in Data Visualization

View Tool

AI Apps

AI-powered tool that generates stunning diagrams, charts, and visualizations. It simplifies the creation of visual assets for presentations, academic papers, and…ChartAI is an AI-powered tool that generates stunning diagrams, charts, and visualizations. It simplifies the creation of visual assets for presentations, academic papers, and…

Data Visualization
Ranked #24 in Data Visualization

Bricks

AI Apps

Bricks is an AI-powered tool that transforms CSV and Excel data into visually appealing dashboards and reports in seconds. It requires no technical skills, making data…

AI Spreadsheet Tools

Ranked #16 in AI Spreadsheet Tools

View Tool

AI Apps

AI-powered tool that transforms CSV and Excel data into visually appealing dashboards and reports in seconds. It requires no technical skills, making data…Bricks is an AI-powered tool that transforms CSV and Excel data into visually appealing dashboards and reports in seconds. It requires no technical skills, making data…

AI Spreadsheet Tools
Ranked #16 in AI Spreadsheet Tools
1 of 8