Description
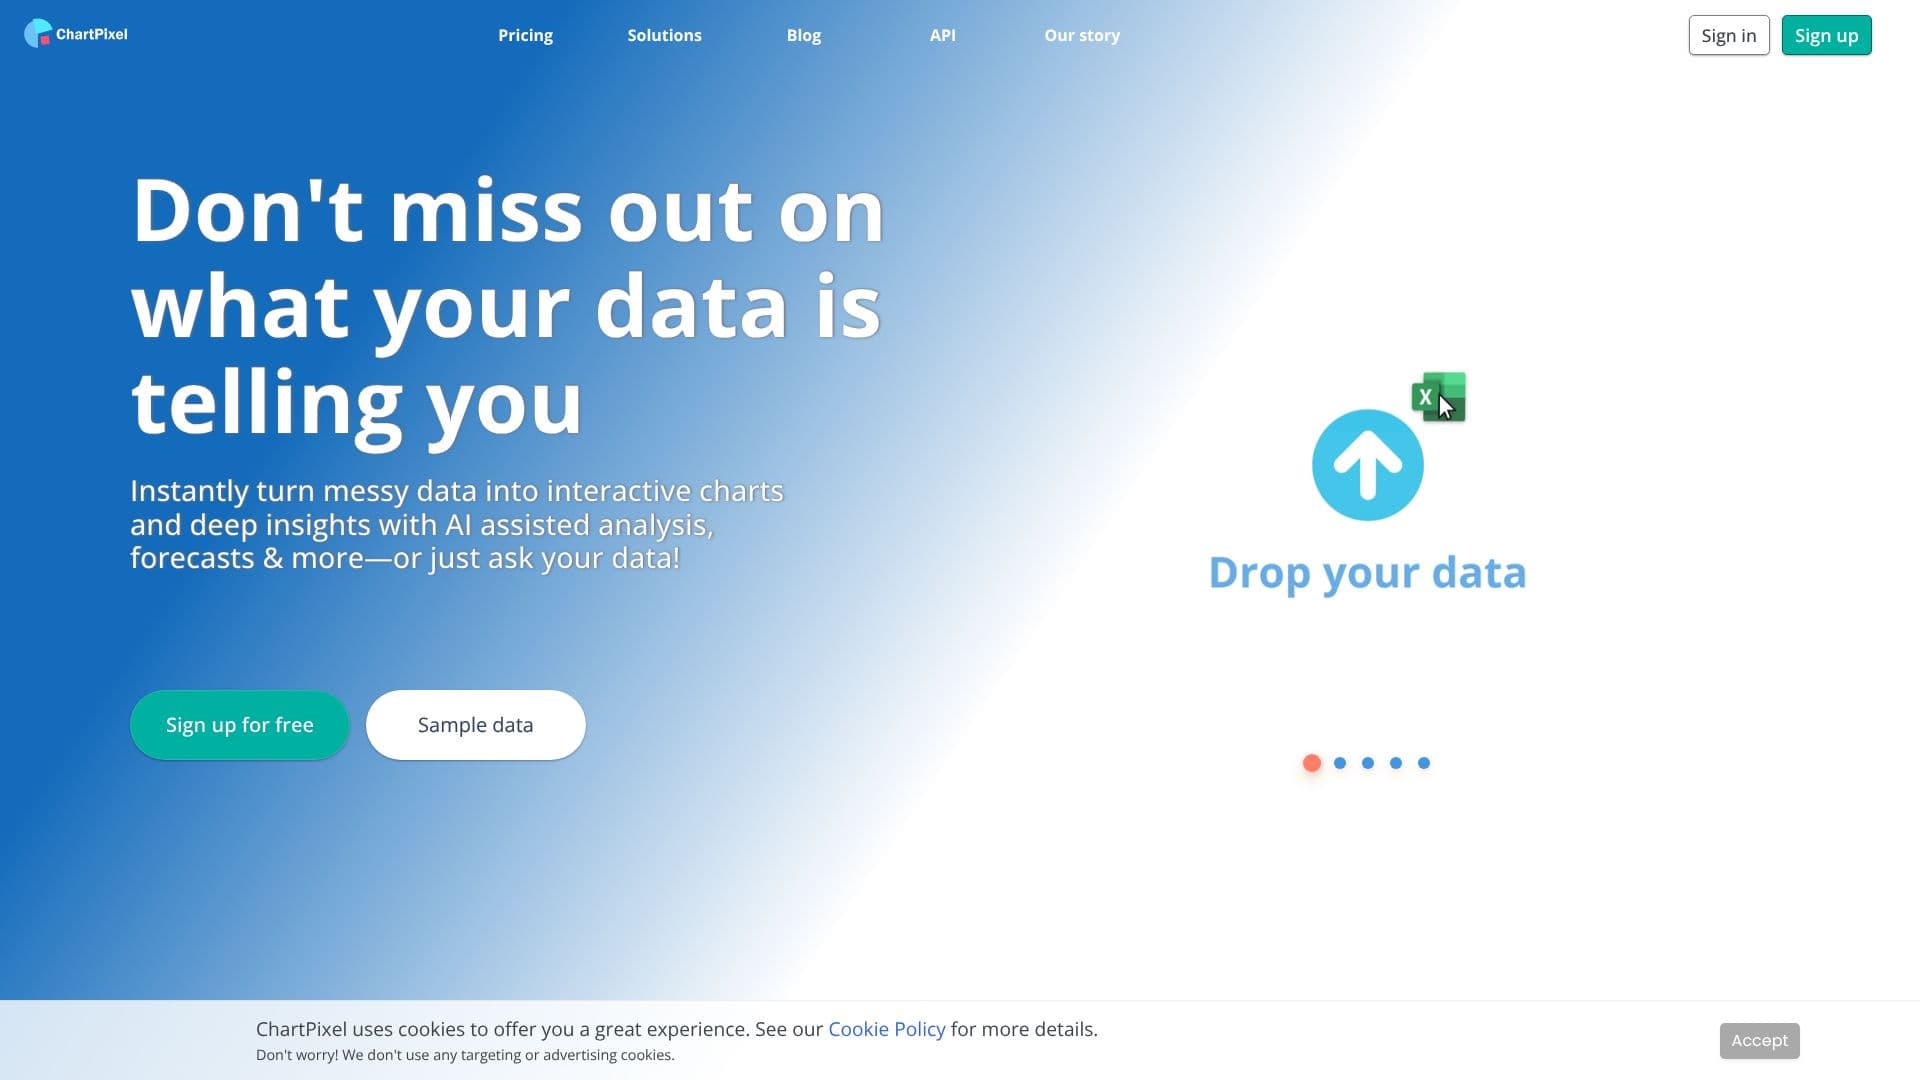
ChartPixel is a user-friendly platform designed to demystify data analysis and make it accessible to everyone. It empowers users to collect, visualize, and analyze data effortlessly, bridging the gap between people and their data. The tool transforms raw data, spreadsheets, and web tables into a gallery of interactive charts and insights.
Read More
With AI assistance, ChartPixel cleans, wrangles, visualizes, and presents data, eliminating the frustrations associated with tools like Excel. It provides actionable insights, statistics, and forecasts, allowing users to make data-driven decisions more effectively. The platform is suitable for both beginners and experienced analytics professionals, offering a no-code, intuitive interface.
Key capabilities include instant AI-assisted analysis, data cleaning, interactive chart generation, sentiment analysis from comments, and one-click presentation slides. ChartPixel also offers features like forecasts, statistical tests, and map charts from zip codes. Users can chat with their data and charts to uncover key information through AI-driven analysis. The platform ensures secure and reliable AI-intelligent output by blending AI power with domain expertise, without training on user data or sending raw data to external LLMs.
ChartPixel's process involves uploading data (Excel, CSV, or from websites), where the platform automatically tidies and enhances it to create insightful charts. These charts are explained with written insights, and users can customize, share online, embed, or export them to PowerPoint. The tool is designed to save time and effort, allowing users to focus on making informed decisions. It supports guided data exploration, making complex data analysis more manageable and educational.
The target audience for ChartPixel includes students, hobby analysts, data analysts, researchers, business owners, and journalists. For students, it serves as an educational tool to explore data analysis without coding. Business owners can gain immediate insights for better decision-making. Journalists can easily create charts and forecasts to enhance their content. Researchers benefit from robust statistical methods and pattern exploration. Hobbyists can analyze personal datasets like sports statistics or collections.
- CategoryAI Data Analysis
- Pricing ModelFreemium
- DeploymentCloud
- PlatformsWeb
ChartPixel AI Data Analysis's Core Features
Instant AI-driven data analysis
Interactive charts and graphs generation
Actionable insights and forecasts
AI-assisted data cleaning and wrangling
Chat with your data functionality
Sentiment analysis from comments
One-click presentation slides export
Map charts from zip codes
Statistical tests and trend analysis
Guided data exploration mode
No-code, user-friendly interface
Secure and reliable AI output
Embeddable and shareable charts
How to use ChartPixel AI Data Analysis?
Upload Data: Drop or upload Excel, CSV files, or read tables from websites.
Lean Back: ChartPixel automatically cleans, enhances, and selects columns for insightful charts.
Get Charts & Insights: Receive explained charts with written insights, ready for customization.
Customize & Share: Further customize charts, share online, embed, or export to PowerPoint.
Chat with Data: Ask questions about your data and charts for deeper understanding.
ChartPixel AI Data Analysis's Use Cases
- Business Data Analysis
- Survey Analysis
- Research and Education
- Journalistic Content
- Personal Data Exploration
- Financial Data Trends