
ToolPotion
AI Advisor
Submit a Tool (Free)

AI Box Plot

Create box and whisker plots online with this free tool. It offers AI analysis, multi-dataset comparison, outlier detection, and export options to PNG, SVG, CSV, and more, all without requiring sign-up.

Visit Website
Share
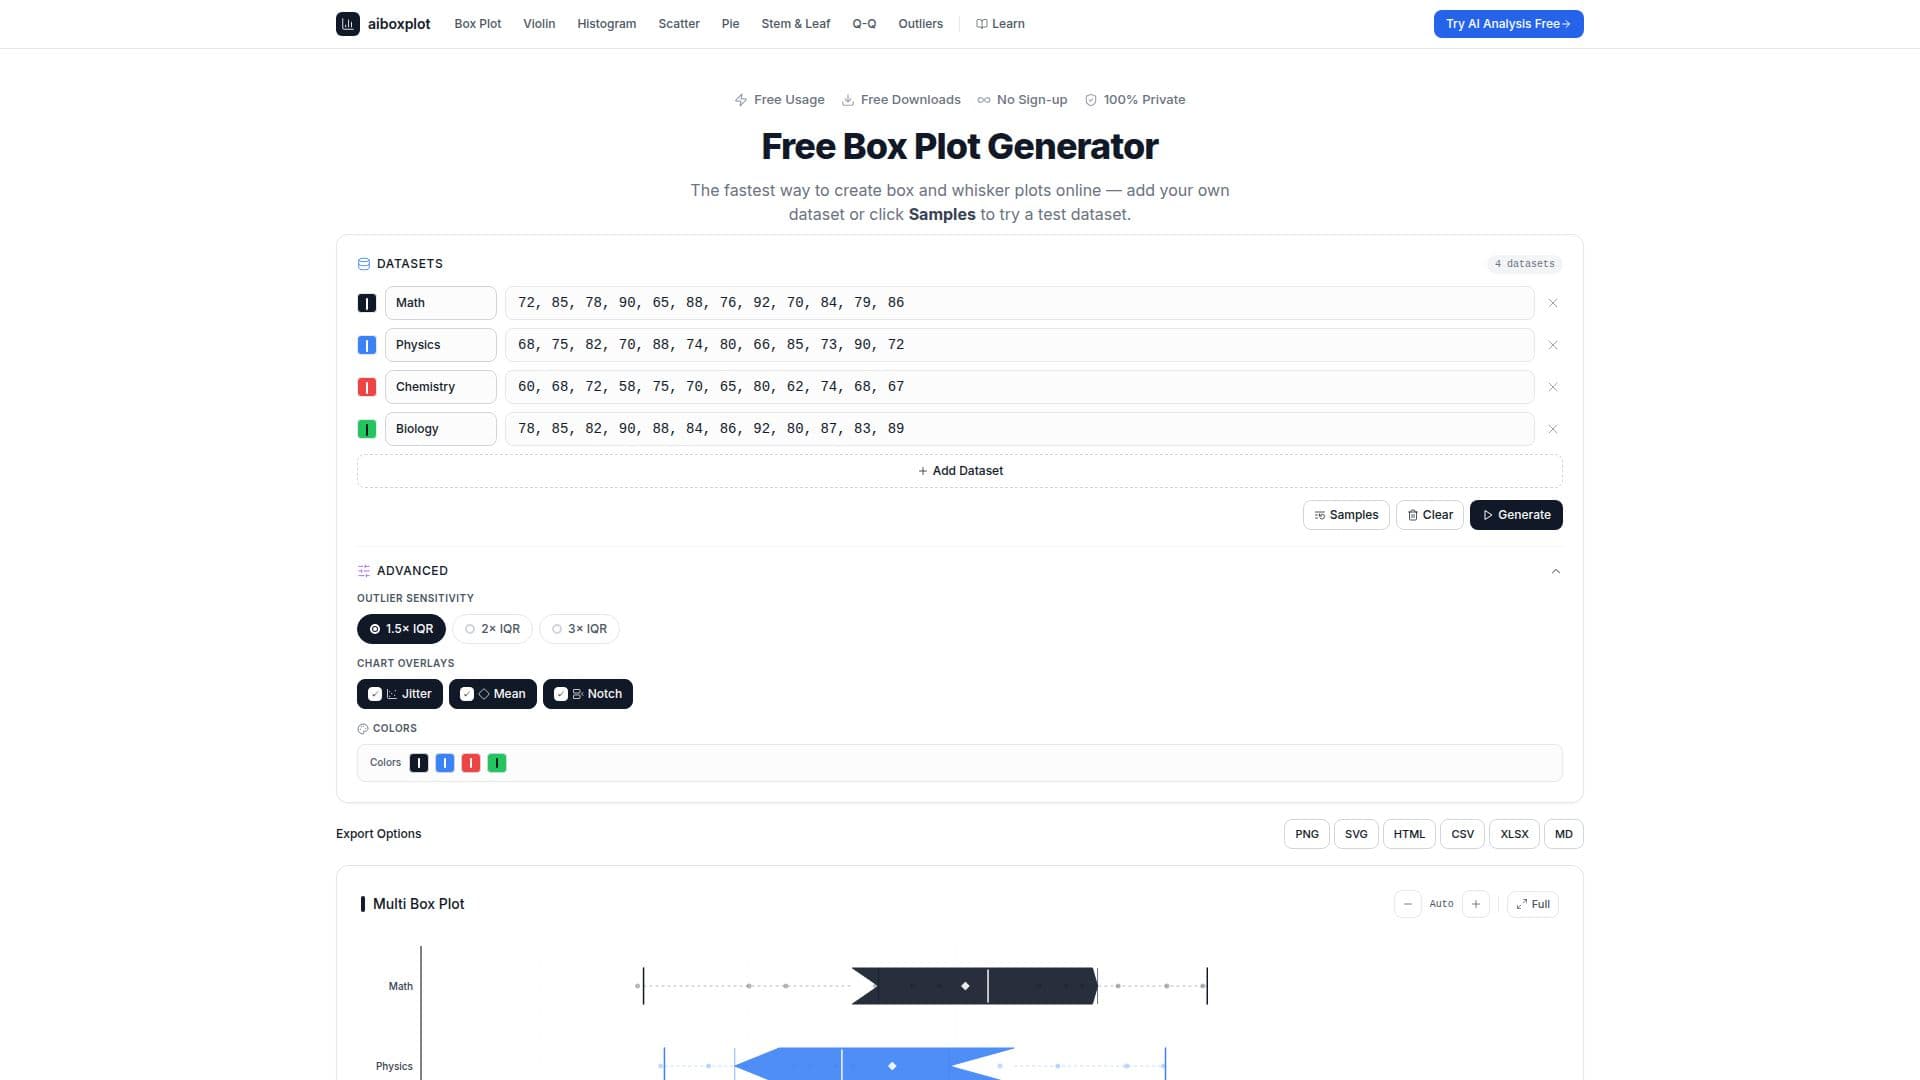
AI Box Plot screenshot

The Free Box Plot Generator is an online tool that allows users to create box and whisker plots quickly and easily. This tool is particularly useful for visualizing the distribution, spread, and skewness of datasets. By displaying the five-number summary—minimum, first quartile (Q1), median, third quartile (Q3), and maximum—it helps users identify outliers at a glance.

Read More

To create a box plot, users simply paste their data into the generator and click 'Generate.' The tool instantly computes the five-number summary and renders an interactive chart. Users can customize colors, toggle overlays, and compare up to 10 datasets side by side. The generator supports various export formats, including PNG, SVG, HTML, CSV, XLSX, and Markdown, allowing for easy sharing and publication-ready outputs.

The Free Box Plot Generator is designed for a wide range of users, including educators, data analysts, researchers, and business professionals. It is particularly beneficial for those who need to visualize data distributions for reports, presentations, or classroom demonstrations. The tool operates entirely in the browser, ensuring that all computations are local and that user data remains private and secure. No sign-up is required, making it accessible for anyone needing to create box plots quickly and efficiently.

In addition to basic box plots, the tool offers advanced features such as the ability to compare multiple datasets, adjust outlier sensitivity, and customize chart aesthetics. Users can also access AI-powered analysis for deeper insights into their data. This makes the Free Box Plot Generator not only a practical tool for creating visualizations but also a valuable resource for statistical analysis and data exploration.

  • CategoryData Visualization
  • Pricing ModelFree
  • DeploymentCloud
  • PlatformsWeb

  • AI Analysis

  • Multi-dataset comparison

  • Outlier detection

  • Export formats: PNG, SVG, CSV, XLSX, HTML, Markdown

  • No sign-up required

  • Interactive chart generation

  • Local computation for privacy

  • Customizable chart colors and overlays

  1. Enter your data: Paste numbers separated by commas, spaces, or line breaks.

  2. Add multiple datasets: Click the + button to compare groups side by side.

  3. Customize your chart: Adjust outlier sensitivity and toggle overlays in the Advanced panel.

  4. Export your results: Download charts in various formats with one click.

  • Educational Assignments
  • Data Analysis
  • Research Presentations
  • KPI Tracking
  • Classroom Demonstrations

AI Box Plot Reviews

Loading...

Popular AI Tools Like AI Box Plot

VibeChart transforms data into shareable charts in seconds using AI. It supports various formats like PDF, Excel, CSV, and plain text, offering over 40 chart types. Ideal for…

Data Visualization
View Tool

Transforms data into shareable charts in seconds using AI. It supports various formats like PDF, Excel, CSV, and plain text, offering over 40 chart types. Ideal for…VibeChart transforms data into shareable charts in seconds using AI. It supports various formats like PDF, Excel, CSV, and plain text, offering over 40 chart types. Ideal for…

Data Visualization
See the Top 250 AI Apps

AI Graph Maker transforms text or data into interactive charts, mind maps, and knowledge graphs effortlessly. This free AI tool generates stunning visualizations in one click,…

Data Visualization

Ranked #225 for Data Analysts

View Tool

Transforms text or data into interactive charts, mind maps, and knowledge graphs effortlessly. This free AI tool generates stunning visualizations in one click,…AI Graph Maker transforms text or data into interactive charts, mind maps, and knowledge graphs effortlessly. This free AI tool generates stunning visualizations in one click,…

Data Visualization
Ranked #225 for Data Analysts

ChartAI

AI Apps

ChartAI is an AI-powered tool that generates stunning diagrams, charts, and visualizations. It simplifies the creation of visual assets for presentations, academic papers, and…

Data Visualization

Ranked #24 in Data Visualization

View Tool

AI Apps

AI-powered tool that generates stunning diagrams, charts, and visualizations. It simplifies the creation of visual assets for presentations, academic papers, and…ChartAI is an AI-powered tool that generates stunning diagrams, charts, and visualizations. It simplifies the creation of visual assets for presentations, academic papers, and…

Data Visualization
Ranked #24 in Data Visualization

Chat2CSV

AI Apps

Chat2CSV turns CSV data into charts through natural-language chat: describe the chart you want, like 'bar chart of sales by region,' and the AI builds it. It supports a wide range…

Data Visualization
View Tool

AI Apps

Turns CSV data into charts through natural-language chat: describe the chart you want, like 'bar chart of sales by region,' and the AI builds it. It supports a wide range…Chat2CSV turns CSV data into charts through natural-language chat: describe the chart you want, like 'bar chart of sales by region,' and the AI builds it. It supports a wide range…

Data Visualization
See the Top 250 AI Apps

Infogram

AI Apps

Infogram is an AI-powered platform that enables users to create interactive charts, maps, infographics, and reports. It allows for easy sharing and embedding, making data…

Data VisualizationMarketing & Creative Agencies

Ranked #16 in Data Visualization

View Tool

AI Apps

AI-powered platform that enables users to create interactive charts, maps, infographics, and reports. It allows for easy sharing and embedding, making data…Infogram is an AI-powered platform that enables users to create interactive charts, maps, infographics, and reports. It allows for easy sharing and embedding, making data…

Data VisualizationMarketing & Creative Agencies
Ranked #16 in Data Visualization

ChartCool

AI Apps

ChartCool is a free AI-powered chart maker that turns natural-language prompts and uploaded data into 20+ chart types, including world and country maps, with PNG, SVG, and…

Data Visualization
View Tool

AI Apps

Free AI-powered chart maker that turns natural-language prompts and uploaded data into 20+ chart types, including world and country maps, with PNG, SVG, and…ChartCool is a free AI-powered chart maker that turns natural-language prompts and uploaded data into 20+ chart types, including world and country maps, with PNG, SVG, and…

Data Visualization
See the Top 250 AI Apps

ChartPixel offers instant AI-driven data analysis, generating interactive charts and actionable insights from messy data. It simplifies data cleaning, visualization, and…

AI Data Analysis

Ranked #74 for Cleaning & formatting data

View Tool

Offers instant AI-driven data analysis, generating interactive charts and actionable insights from messy data. It simplifies data cleaning, visualization, and…ChartPixel offers instant AI-driven data analysis, generating interactive charts and actionable insights from messy data. It simplifies data cleaning, visualization, and…

AI Data Analysis
Ranked #74 for Cleaning & formatting data

Graphy

AI Apps

Graphy transforms messy data into beautiful, branded graphs and compelling stories with AI. It simplifies data presentation, enabling faster decisions and stronger team alignment.…

Data Visualization

Ranked #20 in Data Visualization

View Tool

AI Apps

Transforms messy data into beautiful, branded graphs and compelling stories with AI. It simplifies data presentation, enabling faster decisions and stronger team alignment.…Graphy transforms messy data into beautiful, branded graphs and compelling stories with AI. It simplifies data presentation, enabling faster decisions and stronger team alignment.…

Data Visualization
Ranked #20 in Data Visualization
1 of 8