
Description
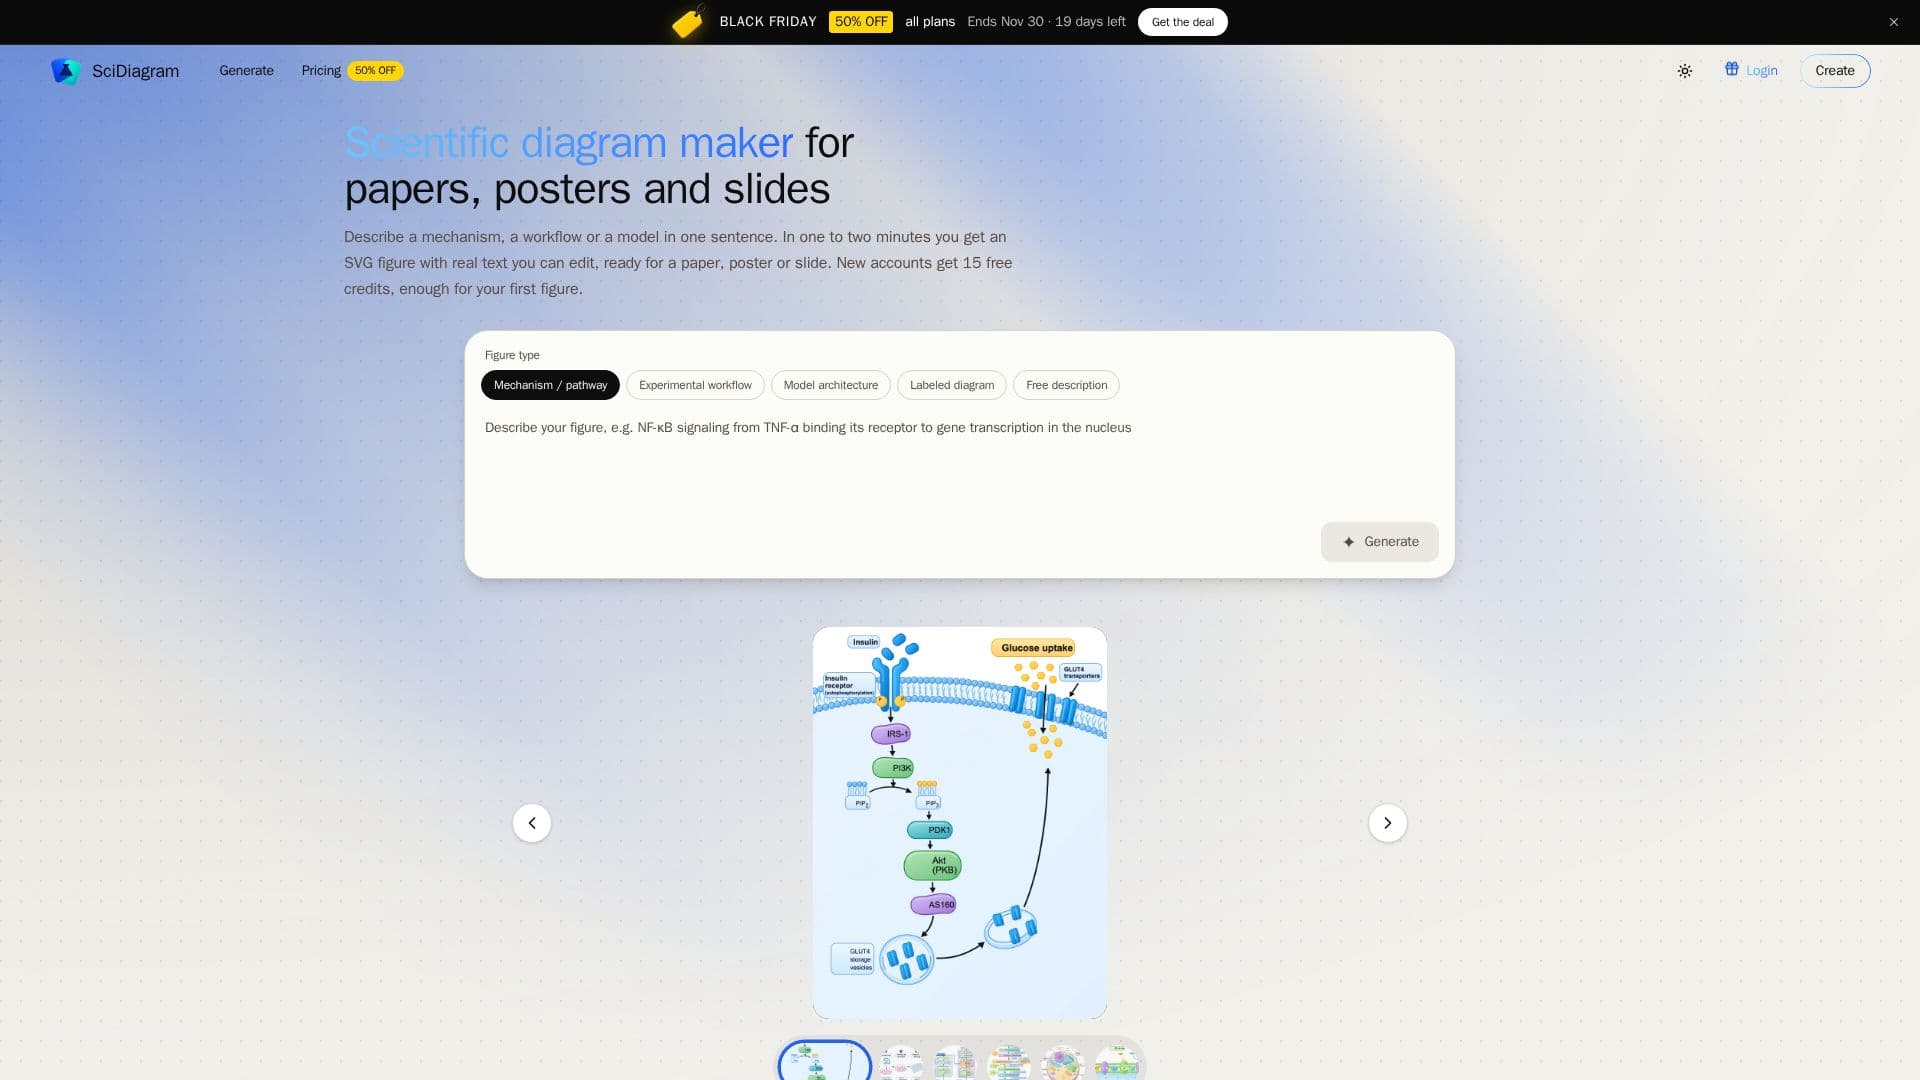
SciDiagram is an independent online product designed to simplify the creation of scientific figures. It allows users to describe a mechanism, workflow, or model in one sentence and receive an editable SVG figure within one to three minutes. This tool is particularly beneficial for graduate students and early-career researchers who require clean, professional schematics for their academic work, including papers, posters, and slides, without the need to learn complex drawing software.
Read More
The platform functions by taking a text prompt and generating a complete first draft of a scientific figure. Users can specify figure types such as mechanism or pathway, experimental workflow, model architecture, or labeled diagram. The generated SVG figures feature real, editable text labels, allowing for easy adjustments to content, font size, weight, and colors directly within the browser-based editor. This ensures that users can quickly correct any inaccuracies or stylistic inconsistencies, rather than starting over from scratch.
SciDiagram also offers additional free, rule-based tools, including a Punnett square generator and a PRISMA 2020 flow diagram generator. These tools operate without requiring an account or credits and can export figures as SVG or PNG. The main figure generator provides new accounts with 15 free credits, sufficient for creating one figure, which downloads as a watermarked PNG for personal use. Subsequent figures or watermark-free SVG downloads require a paid plan or credit pack.
Figures created with SciDiagram are suitable for various scientific communication needs. The editable SVG format ensures compatibility with popular design software like Illustrator, Inkscape, Affinity Designer, Figma, and PowerPoint, allowing for further customization and scaling. The platform emphasizes that while the AI model drafts the labels, users must review and verify all content for scientific accuracy before submission to journals, adhering to publisher guidelines regarding AI-generated images.
SciDiagram is best suited for schematics such as signaling pathways, lab workflows, model architectures, and textbook-style labeled diagrams. It is not intended for data charts like bar graphs or scatter plots, which should be generated using dedicated plotting software. The service runs entirely in the browser, making it accessible on computers and phones without any installation.
- CategoryAI Graphic Design Tools
- Pricing ModelFreemium
- DeploymentCloud
- PlatformsWeb
SciDiagram's Core Features
One-sentence figure generation
Editable SVG output with real text labels
Browser-based editor for text, colors, and layout
Multiple figure types: mechanism, workflow, model architecture, labeled diagram
Fast generation time (approx. 90 seconds per figure)
Free credits for new accounts (15 credits for one figure)
PNG and SVG download options
Commercial use license with paid plans
Automatic refund for failed generation runs
Undo and redo functionality in editor
Saved versions of figures in account
Accessible on computer and phone browsers
Includes free Punnett square generator
Includes free PRISMA 2020 flow diagram generator
How to use SciDiagram?
Pick Figure Type: Select a figure type (e.g., mechanism, workflow, model architecture, labeled diagram, or free description) and describe the content in one sentence.
Generate Figure: Wait one to two minutes for the AI to generate the figure based on your description. Dense figures may take up to three minutes.
Edit Labels and Design: Open the generated figure in the browser editor to review and correct labels, adjust colors, change font sizes, and refine the layout.
Export Figure: Download the final figure as a PNG (2x or 4x resolution) for slides, or as an editable SVG for professional design software after any purchase.
SciDiagram's Use Cases
- Scientific Paper Figures
- Academic Poster Design
- Presentation Slides
- Mechanism and Pathway Diagrams
- Experimental Workflow Visuals
- Model Architecture Schematics
- Textbook-Style Labeled Diagrams
- Quick First Drafts
- Genetics Problem Solving
- Systematic Review Flow Diagrams