
Description
ExplainViz is an AI-powered scientific figure maker specifically developed for researchers to convert their research descriptions into accurate, labeled, and editable diagrams. This tool supports the creation of various academic visuals, including graphical abstracts for journal papers, conceptual framework diagrams for theses and dissertations, theoretical framework diagrams grounded in established theories, and A0/A1 posters for conferences.
Read More
Unlike general image generators such as Midjourney or DALL·E, ExplainViz is purpose-built for scientific communication. While general tools optimize for visual aesthetics and often produce garbled text labels or uneditable raster files, ExplainViz focuses on structured, scientifically accurate diagrams. Every output is designed for academic rigor, ensuring correct labels, directional arrows, and logical layouts that researchers can verify and refine.
The workflow is intuitive and designed to keep scientific judgment in the hands of the researcher. Users begin by describing their findings, variables, relationships, mechanisms, or poster sections. The AI then drafts a structured research diagram, handling layout, sizing, typography, and visual hierarchy automatically. This provides a strong starting point, eliminating the need for design skills.
After generation, every element of the scientific figure—labels, arrows, shapes, and colors—is individually editable. The tool supports vector SVG export, which maintains sharpness at any resolution and can be further edited in software like Illustrator, Inkscape, or Figma. High-resolution PNG is also available for specific journal or conference requirements. Figures remain editable through multiple revision cycles, making it ideal for responding to reviewer comments or committee feedback.
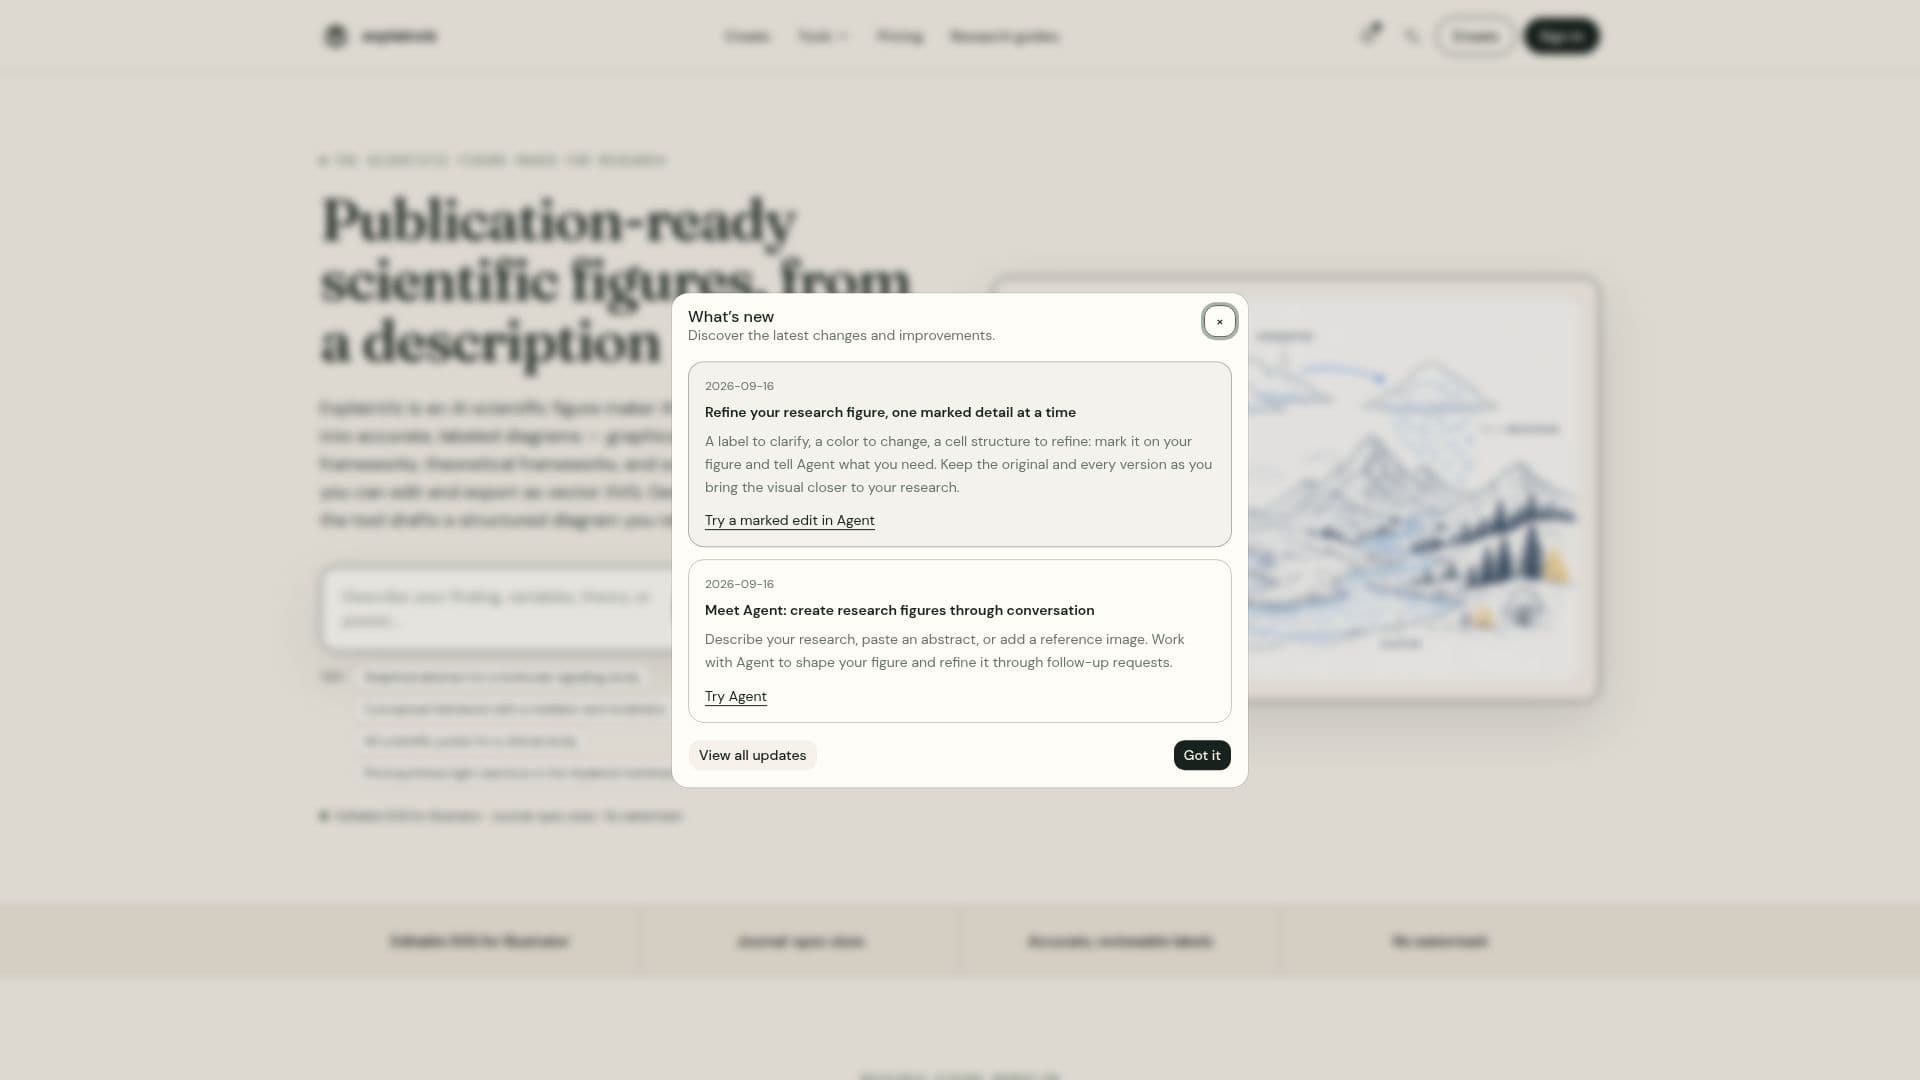
ExplainViz offers a free tier for users to generate and edit diagrams, allowing them to evaluate the tool's capabilities. Additional generation credits are available for purchase, with various packs designed for different usage levels, from single papers to entire research groups. These credits do not expire and unlock the full toolset, including advanced models, 4K output, and editable SVG exports. The platform also features an "Agent" for conversational figure refinement, allowing users to describe changes or paste abstracts to shape their visuals.
- CategoryAI Research Assistants
- Pricing ModelFreemium
- DeploymentCloud
- PlatformsWeb
ExplainViz's Core Features
AI Scientific Figure Generation
Graphical Abstract Maker
Conceptual Framework Generator
Theoretical Framework Generator
Scientific Poster Generator
Editable Vector SVG Export
High-Resolution PNG Export
Individual Element Editing (labels, arrows, shapes, colors)
Automatic Layout and Typography
Publication-Ready Output
Journal-Specific Size Presets
Revision Cycle Support
Conversation-based Figure Refinement (Agent)
No Design Skills Required
Credit-based Pricing Model
How to use ExplainViz?
Describe Research: State findings, variables, relationships, or sections for the scientific figure.
AI Drafts Figure: Receive a structured research diagram with labels, arrows, and logical layout.
Edit and Refine: Review and adjust every label, relationship, layout, color, and typography.
Export Figure: Prepare and export the scientific figure as SVG or high-resolution PNG for publication.
ExplainViz's Use Cases
- Journal Graphical Abstracts
- Conceptual Framework Diagrams
- Theoretical Framework Diagrams
- Conference Research Posters
- Scientific Illustrations
- Peer Review Revisions
- Multi-Disciplinary Research Visuals
- Academic Publication Preparation