
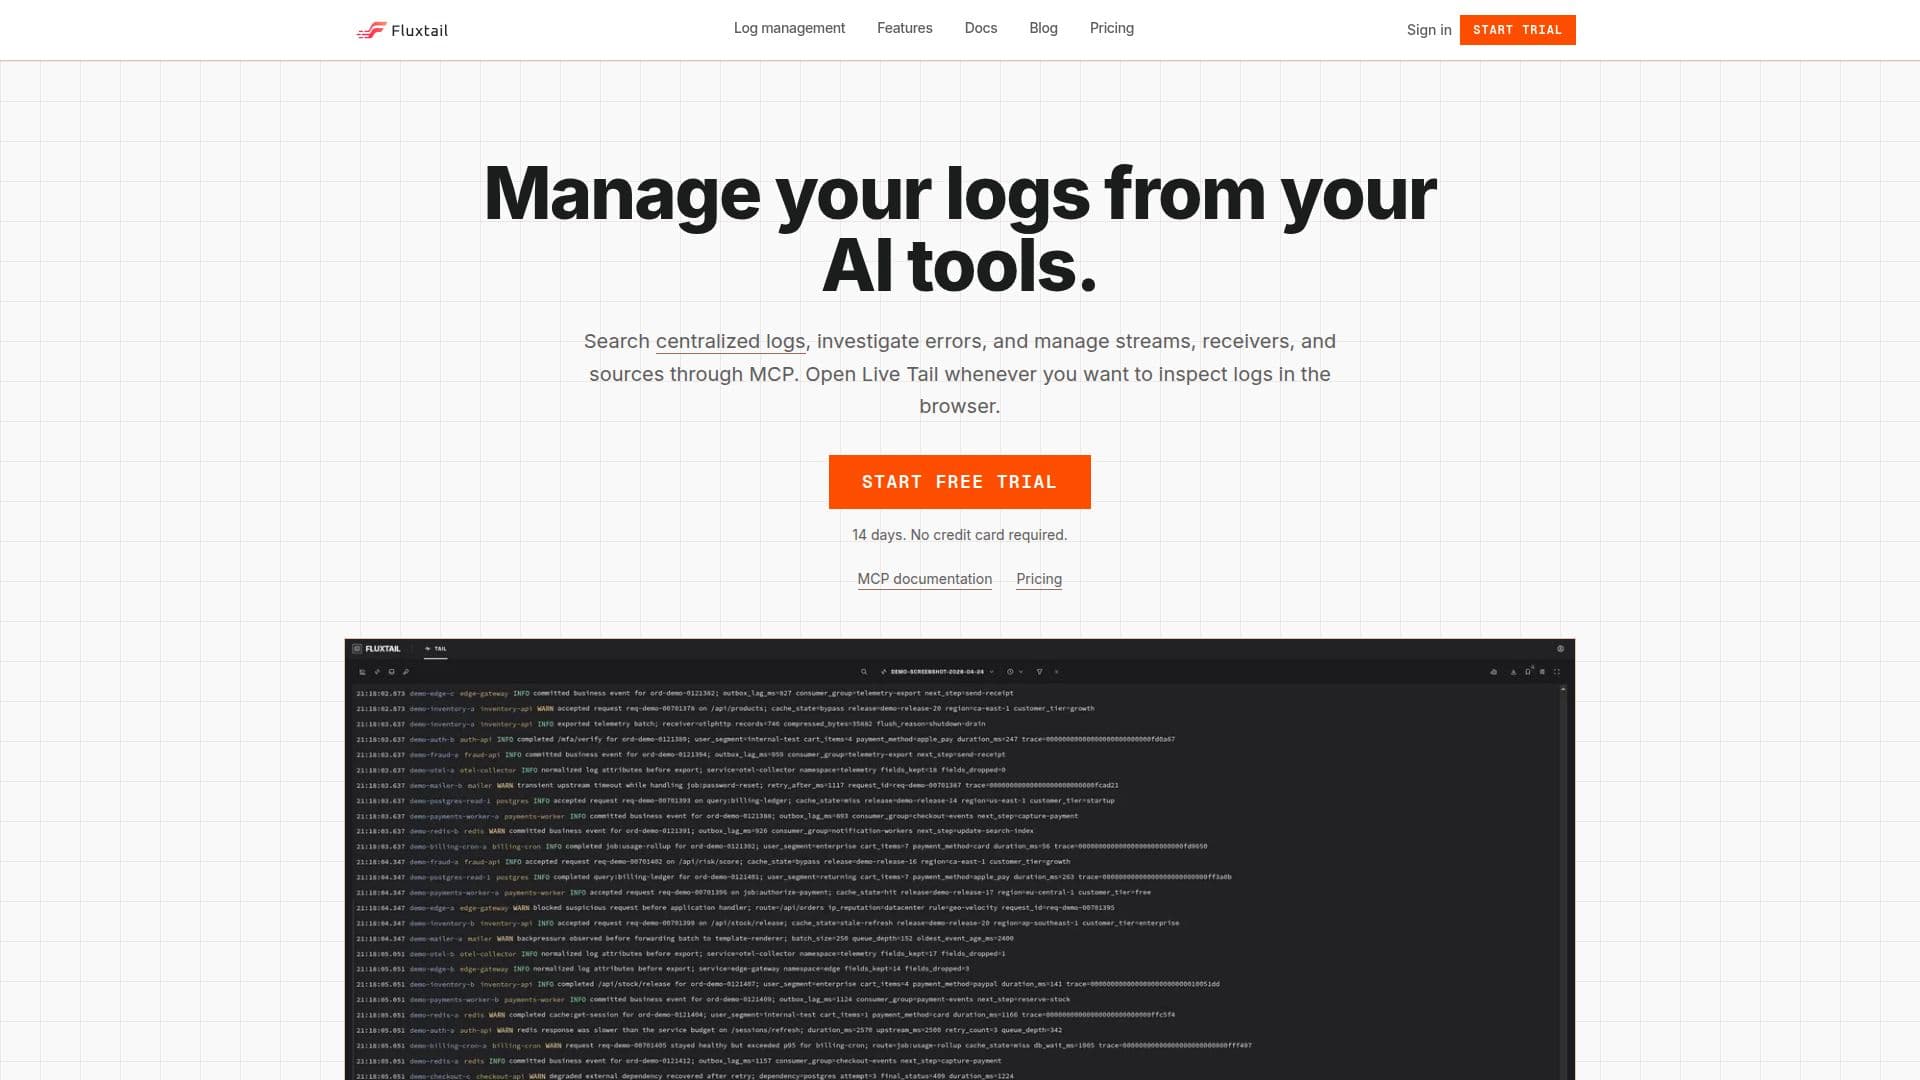
Description
Fluxtail provides a centralized log management solution designed for engineering teams, focusing on straightforward ingest, readable streams, and live traffic inspection. It allows users to collect logs from a wide array of sources, including applications, syslog devices, Kubernetes workloads, OpenTelemetry pipelines, and GELF emitters, consolidating them into a single account for easier management and analysis.
Read More
The platform enables users to search centralized logs, investigate error patterns, and compare activity over time. Key diagnostic features include checking receiver health, diagnosing missing logs, and receiving sender setup guidance. Fluxtail supports connecting popular AI tools such as Codex, Claude Code, Gemini CLI, and VS Code with Copilot through a hosted MCP server, enhancing log analysis capabilities.
Fluxtail emphasizes a clear path from log ingest to investigation. It supports various ingestion protocols like HTTP JSON batches, syslog (RFC 3164/5424), OTLP/OpenTelemetry, GELF, and Kubernetes agents. Users can also leverage client libraries for Go, Python, PHP, NestJS, Node.js, Java, Rust, and .NET. Logs are organized into named streams, allowing teams to separate service families, environments, or source types for focused analysis.
For real-time monitoring, Fluxtail offers a live tail feature, enabling users to inspect logs as they arrive in the browser. This is crucial for confirming receiver activity, following deployment output, and debugging active incidents. The platform also includes advanced features like multi-stream scope, host/app/severity filters, labels, Kubernetes filters, histograms, facets, and historical windows.
Access control is managed through scoped access tokens and hosted OAuth MCP. Fluxtail provides receiver health checks, usage and quota alerts, exception search, error summaries, and no-log diagnostics. Its built-in AI chat assists with investigation by summarizing errors, grouping repeated messages, and checking why a source might be quiet, always grounding its insights in the raw log data.
Fluxtail offers two main pricing plans: Starter at $19 USD/month for 10 GB of stored logs and 30-day retention, and Pro at $49 USD/month for 50 GB of stored logs and 90-day retention. Both plans feature fixed prices with no usage overage fees, though hard plan limits apply. A 14-day trial is available without a credit card, utilizing shared HTTP receivers, with dedicated ports and native sources requiring a paid plan.
- CategoryAI DevOps & Cloud Tools
- Pricing ModelFreemium
- DeploymentCloud
- PlatformsWeb
Fluxtail's Core Features
Centralized Log Management: Consolidate logs from diverse sources into one platform.
Search and Query Logs: Explore error patterns and compare activity over time.
Live Tail: Inspect logs in real-time as they arrive in the browser.
AI Tool Integration: Connect with Codex, Claude Code, Gemini CLI, and VS Code with Copilot.
Diagnostics: Diagnose missing logs, check receiver health, and get sender setup guidance.
Stream and Source Management: Organize logs and configure how they arrive.
Multi-Protocol Ingest: Support for HTTP, syslog, OTLP/OpenTelemetry, GELF, and Kubernetes agents.
Client Library Support: Ingest logs from Go, Python, PHP, Node.js, Java, Rust, and .NET applications.
Scoped Access Tokens: Control access with granular permissions.
Usage and Quota Alerts: Monitor log volume and retention limits.
Exception Search and Error Summaries: Quickly identify and understand issues.
Built-in AI Chat: AI-assisted analysis for summaries and diagnostics.
Fixed Pricing: No usage overage fees with clear plan limits.
14-Day Free Trial: Start without a credit card.
OAuth Connectivity: Securely approve access to Fluxtail accounts.
How to use Fluxtail?
Create Account: Start your 14-day free trial without a credit card.
Send Logs: Use shared HTTP receivers during the trial; dedicated ports require a paid plan.
Connect AI Tool: Install Codex CLI or use Claude Code, Gemini CLI, or VS Code with Copilot, then sign in and approve account access.
Configure Sources: Set up ingestion paths like HTTP, Syslog, OTLP, GELF, or collectors.
Route to Streams: Organize logs into named streams for better readability and filtering.
Monitor Live Traffic: Use live tail to confirm event arrival and debug in real-time.
Filter and Analyze: Apply filters, facets, MCP diagnostics, or AI chat to narrow down and understand log data.
Fluxtail's Use Cases
- Kubernetes Log Aggregation
- Fluent Bit Forwarding
- Syslog Centralization
- OpenTelemetry Application Logs
- Live-Tail Incident Response
- AI Log Diagnostics
- Docker Container Log Management
- Error Pattern Exploration
- Receiver Health Monitoring
- Stream-Based Log Organization