
Description
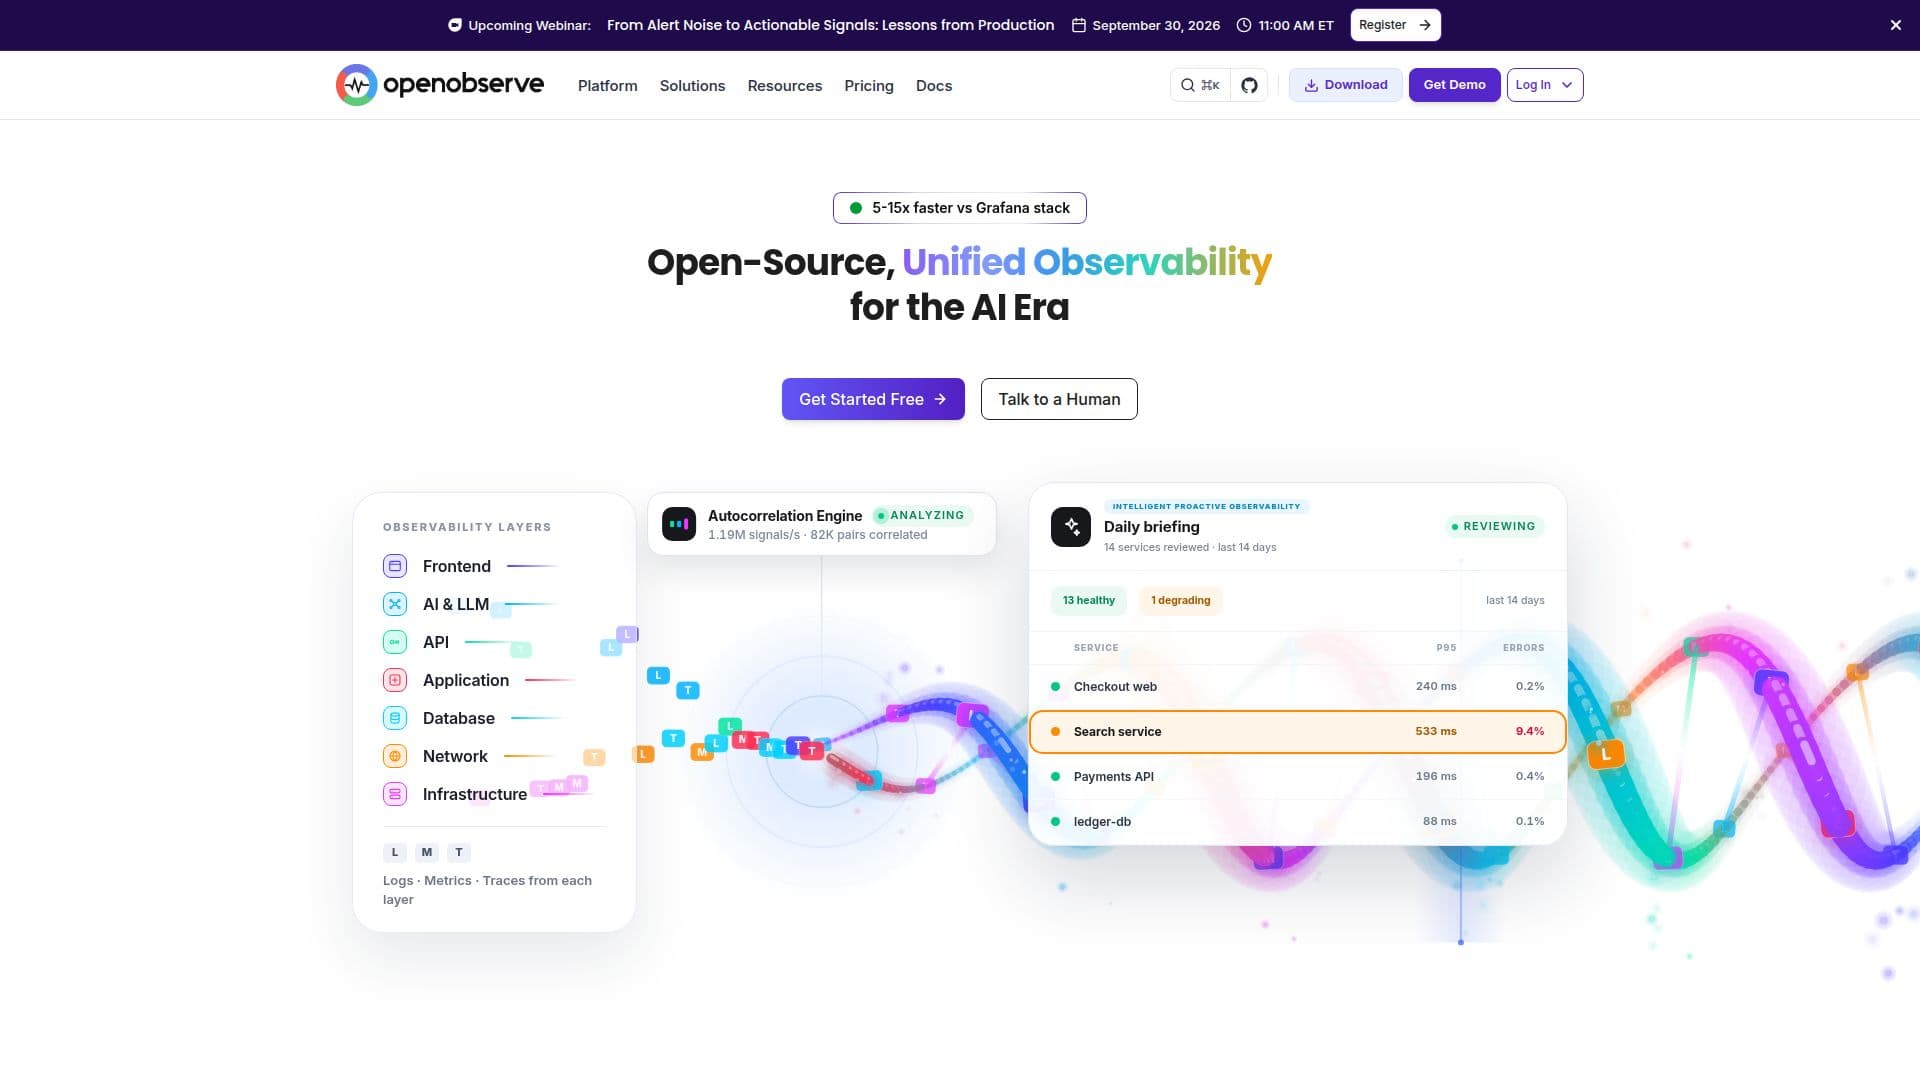
OpenObserve is an open-source observability platform that provides comprehensive monitoring solutions for logs, metrics, and traces. Built in Rust, it leverages Apache Parquet columnar storage to deliver high-performance data management with significantly reduced storage costs. The platform is designed to handle petabyte-scale log searches and metrics queries, allowing users to ingest and query trillions of log lines using familiar SQL syntax without incurring indexing taxes or surprise storage bills.
OpenObserve supports a wide range of monitoring capabilities, including real user monitoring, synthetic monitoring, and distributed tracing. It enables users to follow requests across services with full trace context, auto-correlated with logs and metrics. The platform also offers advanced features such as AI SRE agents for incident triage and root cause analysis, as well as AI assistants that provide natural-language answers to complex queries.
The platform is OpenTelemetry-native, supporting standardized collection and integration with over 100 different systems, including Prometheus, Fluent Bit, and Vector. Deployment options are flexible, allowing users to choose between fully managed cloud services, self-hosted setups, or air-gapped environments. OpenObserve's enterprise edition includes additional features like SSO, RBAC, audit trails, and SOC 2 Type II compliance.
OpenObserve is particularly cost-effective compared to industry leaders like Datadog, Grafana, and Elastic, offering up to 140x lower storage costs and 8x more cost-effective solutions. It provides a unified platform for monitoring various environments, including Kubernetes, AWS, Azure, GCP, databases, applications, networks, and AI workloads, all correlated on a single timeline.
OpenObserve: Observability Platform's Core Features
Open-source observability platform
Built in Rust with Apache Parquet storage
140x lower storage costs
Petabyte-scale log search
Prometheus-compatible metrics
Distributed tracing with full trace context
AI SRE agent for incident triage
OpenTelemetry-native integration
Flexible deployment options
Enterprise features like SSO and RBAC
How to use OpenObserve: Observability Platform?
Install: Deploy OpenObserve locally or on Kubernetes
Ingest: Send logs, metrics, or traces to the platform
Analyze: Use SQL and PromQL for data querying
Visualize: Build dashboards with drag-and-drop panels
Monitor: Set alerts and notifications for anomalies
Optimize: Use AI tools for incident management
OpenObserve: Observability Platform's Use Cases
- Kubernetes Monitoring
- AWS Monitoring
- Azure Monitoring
- Database Monitoring
- AI & LLM Monitoring
- Application Monitoring
- Network Monitoring
- Synthetic Monitoring
- Real User Monitoring
- Incident Management