
ToolPotion
AI Advisor
Submit a Tool (Free)

hotpath-rs

AI AppsCoding & DevelopmentOpen Source · Rust

hotpath-rs is an open-source Rust performance profiler designed to help developers identify bottlenecks in CPU, memory, async tasks, SQL queries, and more. It integrates with Prometheus and Grafana for comprehensive monitoring and offers a live TUI dashboard for real-time analysis.

Visit Website
Share
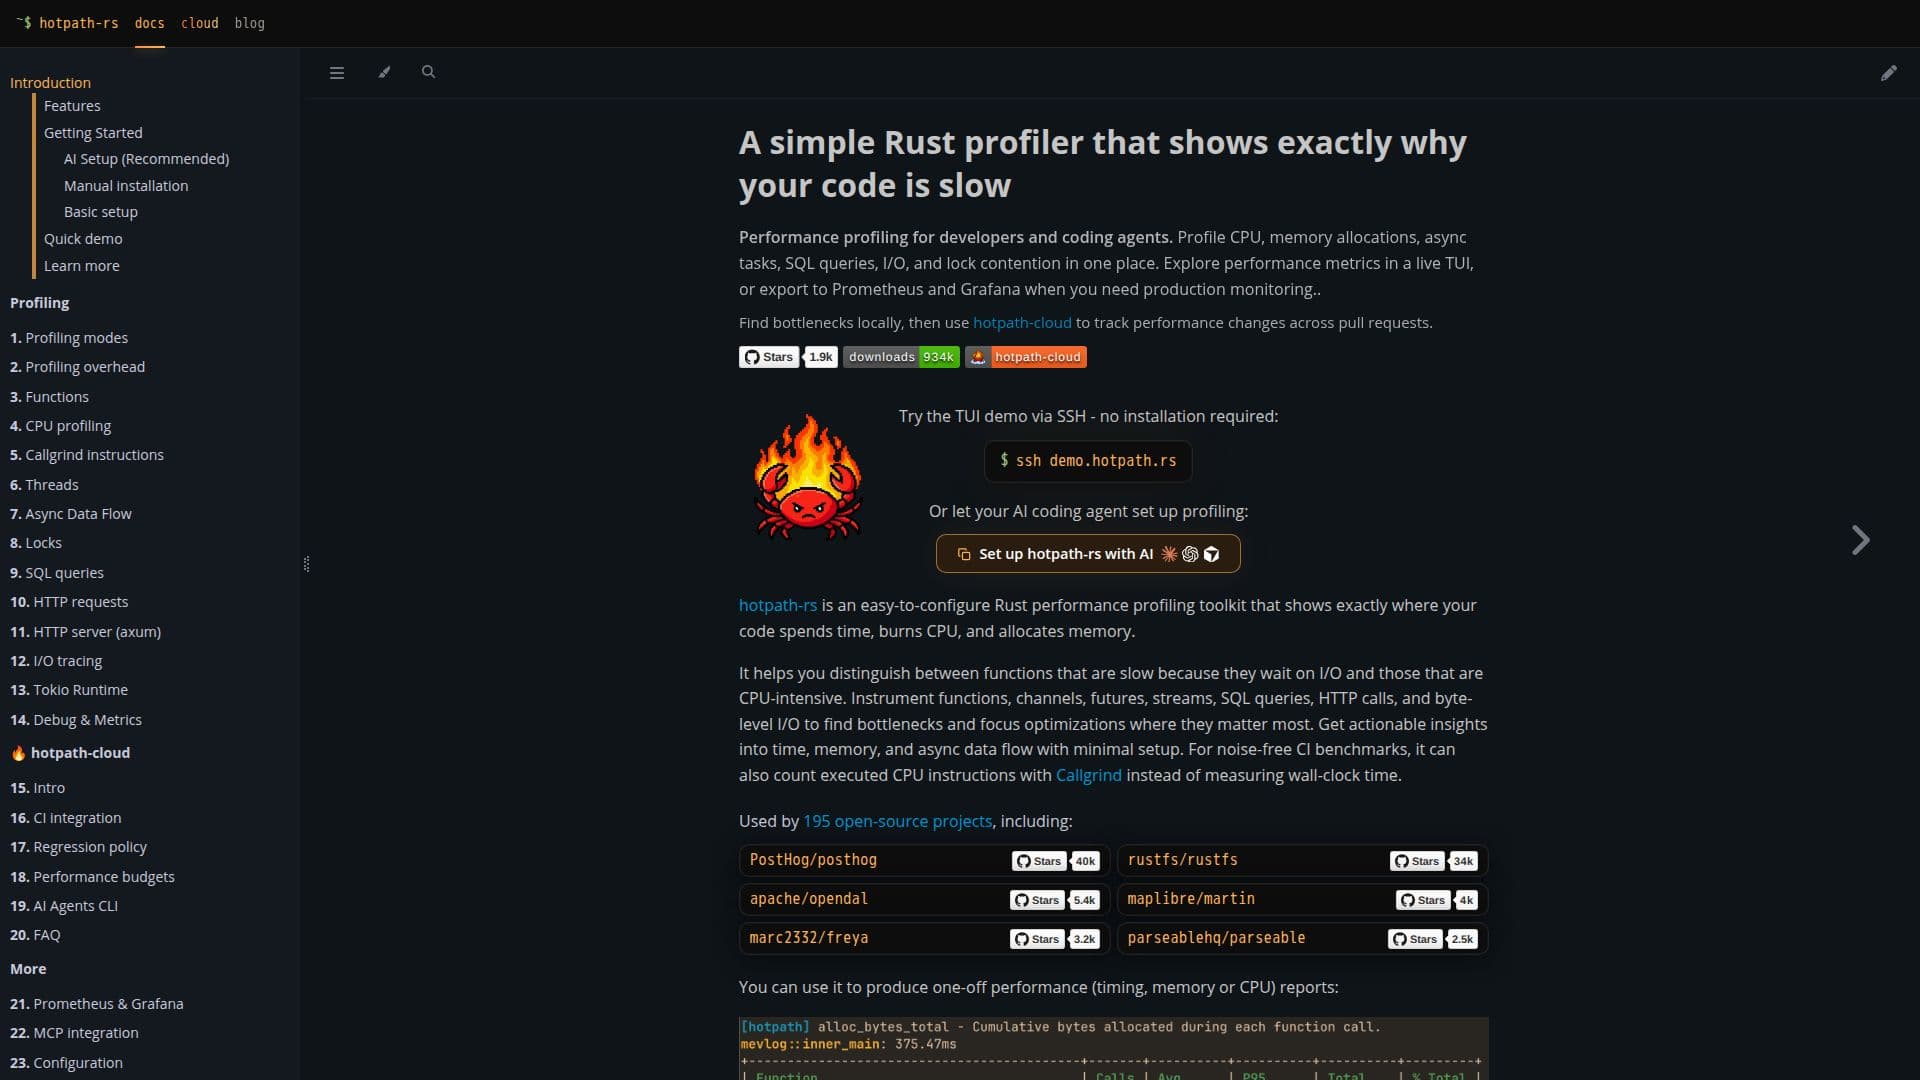
hotpath-rs screenshot

hotpath-rs is an open-source performance profiler tailored for Rust developers aiming to optimize their code's efficiency. It provides detailed insights into CPU usage, memory allocations, async data flow, and more, allowing developers to pinpoint performance bottlenecks effectively. The tool supports profiling of functions, channels, futures, streams, SQL queries, HTTP calls, and byte-level I/O, making it a versatile choice for various applications.

Read More

One of the standout features of hotpath-rs is its integration with Prometheus and Grafana, enabling users to export profiling metrics to existing dashboards for production monitoring. The tool also offers a live TUI dashboard for real-time analysis and static reports for one-off evaluations. Developers can benefit from its ability to distinguish between functions that are slow due to I/O waits and those that are CPU-intensive, providing actionable insights for optimization.

hotpath-rs is particularly useful for developers working with async Rust and Tokio applications, offering metrics for worker thread utilization, task scheduling, and queue depths. It also supports SQL query profiling for sqlx and Diesel, as well as HTTP request profiling for reqwest and ureq. The profiler's concurrency metrics help track Mutex/RwLock wait times and contention, ensuring efficient resource management.

The tool is designed to be minimally intrusive, with profiling overheads kept to a few tens of nanoseconds per operation. It supports deterministic instruction counts using Callgrind, making it suitable for noise-free CI benchmarks. hotpath-rs is free to use during its open beta, with plans for a free tier for public repositories post-beta.

  • CategoryCoding & Development
  • Pricing ModelOpen Source
  • DeploymentCloud
  • PlatformsRust

  • Time, CPU & memory profiling

  • Async observability

  • I/O monitoring

  • SQL query profiling

  • HTTP calls profiling

  • Concurrency metrics

  • Prometheus & Grafana integration

  • Live TUI dashboard & static reports

  • CI regression detection

  • Deterministic instruction counts

  1. Configure: Set up profiling features

  2. Use: Profile functions and tasks

  3. Optimize: Analyze metrics for bottlenecks

  4. Integrate: Export data to Prometheus & Grafana

  • CPU Profiling
  • Memory Leak Detection
  • Async Task Monitoring
  • SQL Query Optimization
  • HTTP Request Analysis

hotpath-rs Reviews

Loading...

Popular AI Tools Like hotpath-rs

Amazon CodeGuru Profiler helps developers optimize code performance by identifying costly lines of code, reducing operational costs, and improving application efficiency through…

AI Code Review & Testing

Ranked #3 in AI Code Review & Testing

View Tool

Helps developers optimize code performance by identifying costly lines of code, reducing operational costs, and improving application efficiency through…Amazon CodeGuru Profiler helps developers optimize code performance by identifying costly lines of code, reducing operational costs, and improving application efficiency through…

AI Code Review & Testing
Ranked #3 in AI Code Review & Testing

OpenObserve is an open-source observability platform designed for logs, metrics, and traces. Built in Rust, it offers high-performance monitoring with 140x lower storage costs,…

AI DevOps & Cloud Tools

Ranked #55 for Debugging code

View Tool

Open-source observability platform designed for logs, metrics, and traces. Built in Rust, it offers high-performance monitoring with 140x lower storage costs,…OpenObserve is an open-source observability platform designed for logs, metrics, and traces. Built in Rust, it offers high-performance monitoring with 140x lower storage costs,…

AI DevOps & Cloud Tools
Ranked #55 for Debugging code

Raygun provides comprehensive application monitoring for web and mobile apps, enabling developers to detect, diagnose, and resolve issues affecting end users. It offers real-time…

AI DevOps & Cloud Tools
View Tool

Provides comprehensive application monitoring for web and mobile apps, enabling developers to detect, diagnose, and resolve issues affecting end users. It offers real-time…Raygun provides comprehensive application monitoring for web and mobile apps, enabling developers to detect, diagnose, and resolve issues affecting end users. It offers real-time…

AI DevOps & Cloud Tools
See the Top 250 AI Apps

New Relic

AI Apps

New Relic is an AI-powered observability platform that correlates telemetry across your entire stack, helping you isolate root causes and reduce MTTR. It offers a unified data…

AI DevOps & Cloud Tools

Ranked #15 for Monitoring AI models

View Tool

AI Apps

AI-powered observability platform that correlates telemetry across your entire stack, helping you isolate root causes and reduce MTTR. It offers a unified data…New Relic is an AI-powered observability platform that correlates telemetry across your entire stack, helping you isolate root causes and reduce MTTR. It offers a unified data…

AI DevOps & Cloud Tools
Ranked #15 for Monitoring AI models

Nuclio is an open-source serverless platform designed for high-performance data processing. It enables developers to build and run auto-scaling applications without managing…

MLOps & Model DeploymentHealthcare & Life Sciences
View Tool

Open-source serverless platform designed for high-performance data processing. It enables developers to build and run auto-scaling applications without managing…Nuclio is an open-source serverless platform designed for high-performance data processing. It enables developers to build and run auto-scaling applications without managing…

MLOps & Model DeploymentHealthcare & Life Sciences
See the Top 250 AI Apps

ManagePrompt is an open-source local LLM call debugger that captures every API call during development. It provides full request/response details, token usage, cost estimation,…

Prompt Engineering Tools

Ranked #241 for Monitoring AI models

View Tool

Open-source local LLM call debugger that captures every API call during development. It provides full request/response details, token usage, cost estimation,…ManagePrompt is an open-source local LLM call debugger that captures every API call during development. It provides full request/response details, token usage, cost estimation,…

Prompt Engineering Tools
Ranked #241 for Monitoring AI models

WatchTower

AI Apps

WatchTower is an AI-powered visualization tool designed to help developers understand and optimize AWS DynamoDB provisional capacities. It offers a user-friendly dashboard for…

AI DevOps & Cloud Tools
View Tool

AI Apps

AI-powered visualization tool designed to help developers understand and optimize AWS DynamoDB provisional capacities. It offers a user-friendly dashboard for…WatchTower is an AI-powered visualization tool designed to help developers understand and optimize AWS DynamoDB provisional capacities. It offers a user-friendly dashboard for…

AI DevOps & Cloud Tools
See the Top 250 AI Apps

Tokenwise

AI Apps

Tokenwise is a cost and performance optimization tool for LLM APIs. It helps developers and small teams save over 30% on API costs by monitoring usage, detecting waste, and…

AI DevOps & Cloud Tools

Ranked #159 in AI DevOps & Cloud Tools

View Tool

AI Apps

Cost and performance optimization tool for LLM APIs. It helps developers and small teams save over 30% on API costs by monitoring usage, detecting waste, and…Tokenwise is a cost and performance optimization tool for LLM APIs. It helps developers and small teams save over 30% on API costs by monitoring usage, detecting waste, and…

AI DevOps & Cloud Tools
Ranked #159 in AI DevOps & Cloud Tools
1 of 8