Description
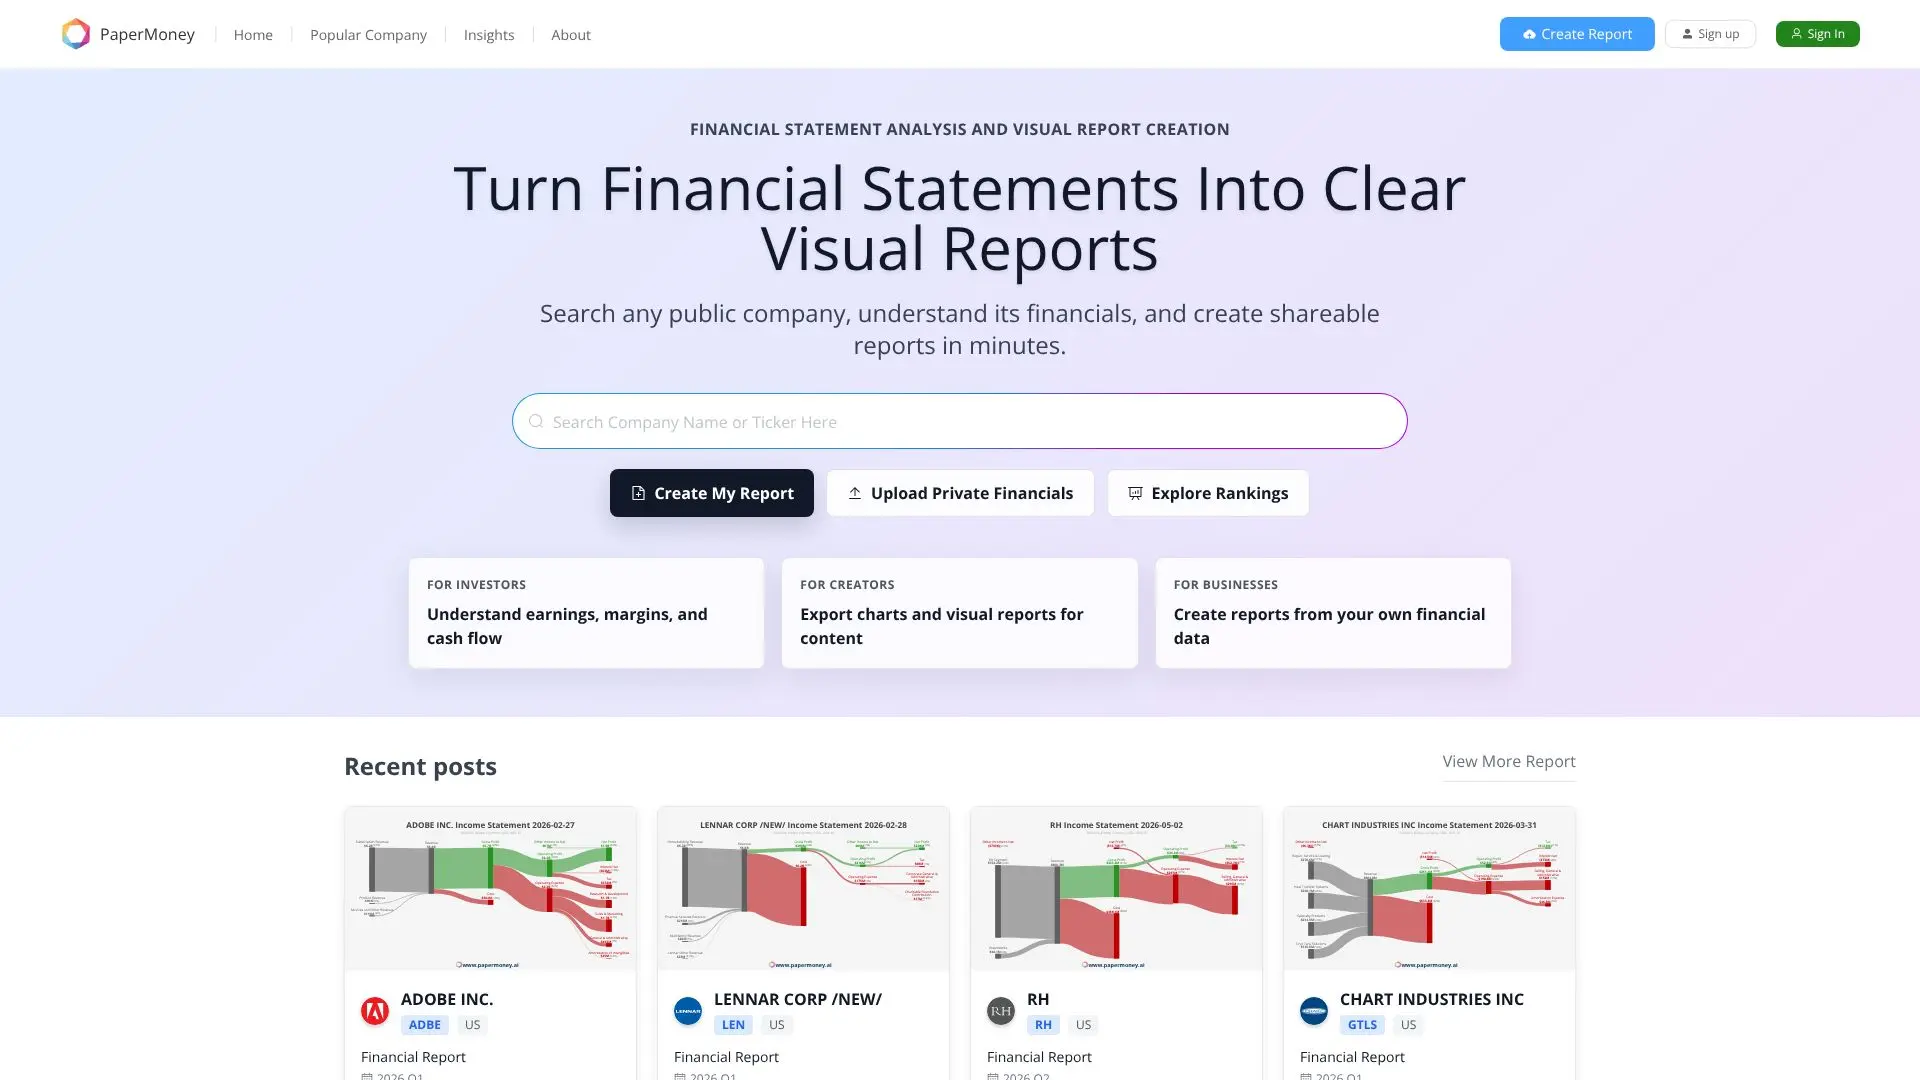
PaperMoney.ai offers a powerful platform for visualizing and analyzing financial data from public companies and private financials. The tool allows users to search for any public company, delve into its financial statements, and generate shareable visual reports within minutes. This capability is invaluable for investors seeking to understand earnings, margins, and cash flow, for content creators who need to export charts and visual data for their work, and for businesses looking to create reports from their own financial data.
Read More
The platform breaks down complex financial statements into easily digestible visual formats. Users can explore income statements, revenue breakdowns, profit margins, and segment performance for a wide range of companies. Examples provided in the content showcase detailed reports for Adobe Inc., Lennar Corp., RH, and Chart Industries Inc., illustrating the depth of analysis available. These reports include key financial metrics such as revenue, gross profit, operating profit, net profit, and various expense categories, alongside revenue segmentation by product or service type.
Beyond public companies, PaperMoney.ai also supports the creation of reports from private financial data, offering flexibility for businesses to gain insights from their internal financials. The platform's ability to generate rankings, such as gross margin, net margin, and market cap, further aids users in comparing companies and identifying top performers. Industry analysis and regional market breakdowns are also available, providing a comprehensive view of the financial landscape.
PaperMoney.ai aims to democratize financial analysis by making complex data accessible and understandable through intuitive visualizations. Whether you are an individual investor researching stocks, a journalist creating financial content, or a business owner analyzing performance, PaperMoney.ai provides the tools to transform raw financial data into actionable insights. The platform emphasizes clarity, speed, and shareability, empowering users to make more informed decisions.
- CategoryFinancial Analysis Tools
- DeploymentCloud
- PlatformsWeb
PaperMoney's Core Features
Visual financial report generation for public companies
Analysis of income statements, revenue, and profit margins
Creation of reports from private financial data
Exportable charts and visual data for content creation
Financial statement analysis tools
Company financial data search functionality
Profitability and margin analysis
Industry comparison capabilities
Financial rankings (gross margin, net margin, market cap)
Regional market analysis
Custom report creation from uploaded financial data
How to use PaperMoney?
Search for Public Company: Enter a public company's name or ticker symbol.
Analyze Financials: Review the generated visual reports, income statements, and key metrics.
Create Private Reports: Upload your own financial data to generate custom visualizations.
Export & Share: Download charts and reports for use in presentations, articles, or business analysis.
Explore Rankings: Utilize financial rankings to compare companies by profitability and market value.
Understand Industry Trends: Analyze data within specific industries and regions.
PaperMoney's Use Cases
- Investor Research
- Content Creation
- Business Analysis
- Financial Literacy
- Performance Tracking
- Industry Benchmarking
- Market Trend Analysis