Description
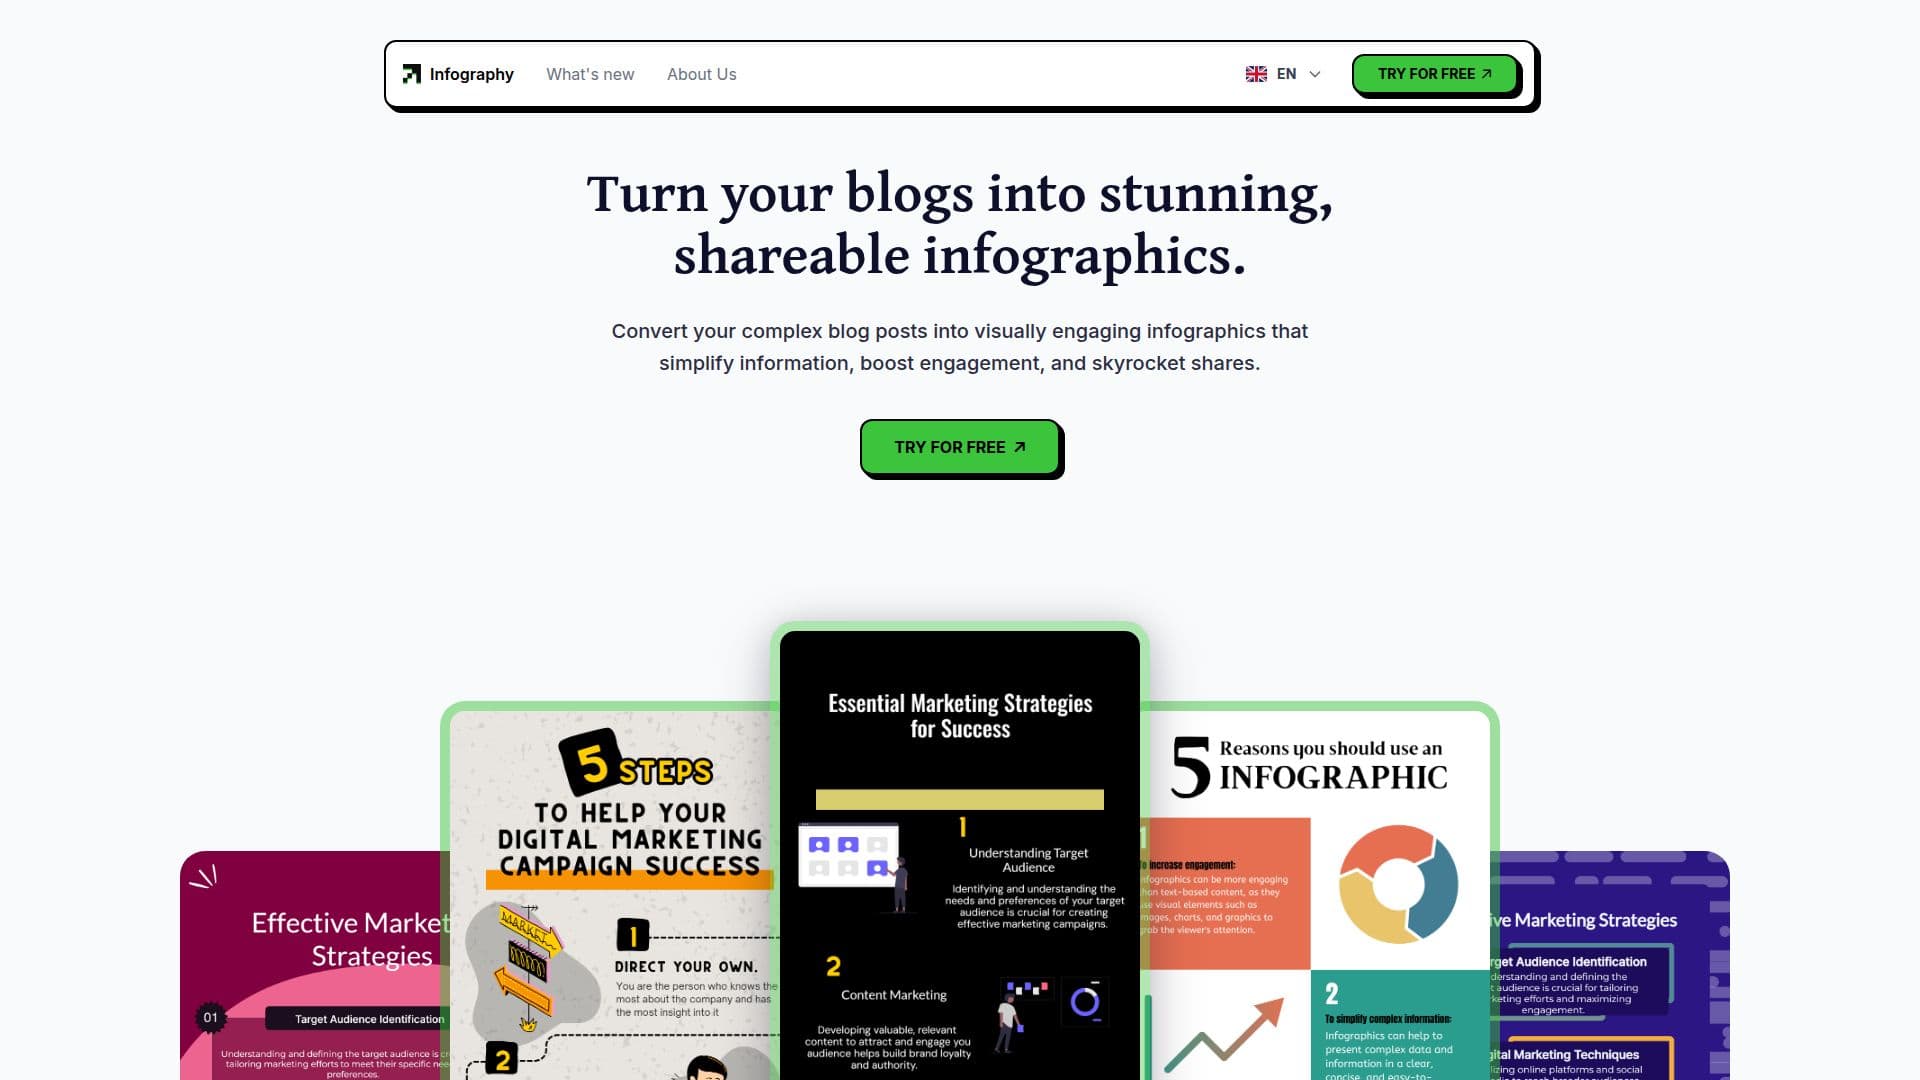
Infography converts blog posts and written content into visually engaging infographics using AI. Users enter a blog link or a text prompt, and the tool analyzes the content, extracts key points, and generates infographics designed to simplify information and boost engagement and shares.
Read More
Each run produces several infographics at once, with different styles and unique content, so users can pick the versions that work best. The tool aims to replace the traditional multi-hour workflow of research, design planning, and visual creation with a process that takes seconds. It supports creation from a topic or content and reports supporting many languages.
Infography also offers an API and Make.com integration for automating infographic generation. This lets users trigger infographic creation from new blog posts, apply brand colors and styling, and automatically post generated visuals to social media as part of a content automation workflow. The API is in beta, with each request consuming one credit.
- CategoryAI Graphic Design Tools
- Pricing ModelPaid
- DeploymentCloud
- PlatformsWeb
Infography's Core Features
Blog URL or text to infographic generation
Multiple infographic variations per run
AI content analysis and key-point extraction
Customizable templates with brand colors
API for automated infographic generation
Make.com integration for content workflows
Auto-posting to social media platforms
Full usage rights over generated infographics
How to use Infography?
Enter your source: Paste a blog link or a text prompt with the content or topic.
Generate infographics: The AI analyzes the content and creates several infographic variations.
Choose and customize: Pick the styles you like and apply your brand colors if needed.
Download or share: Export the infographics for use or auto-post them via the API and Make.com.
Infography's Use Cases
- Blog to infographic
- Social media content
- Automated content workflows
- Marketing visuals