
Description
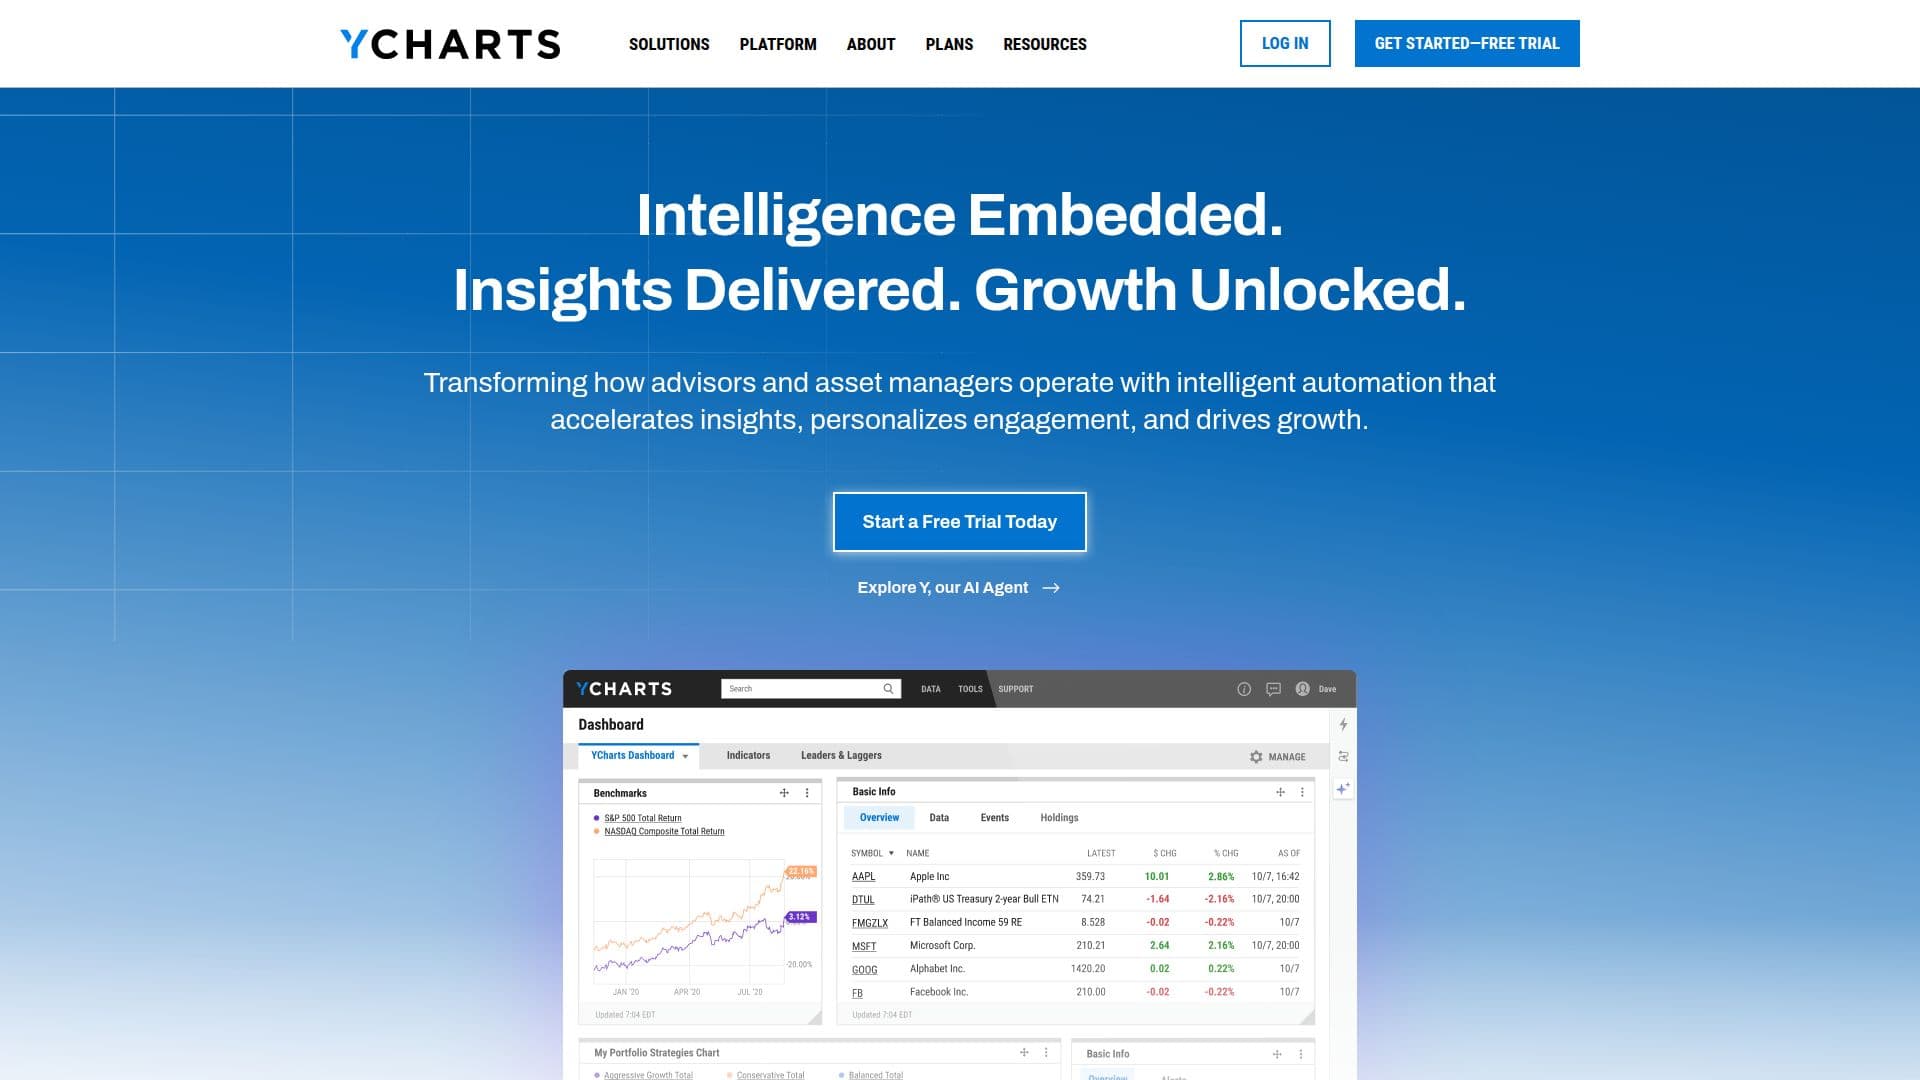
YCharts is a comprehensive financial research and analytics platform tailored for investment professionals, including asset managers and advisors. It offers a suite of tools that facilitate data analysis, portfolio construction, and client engagement, making it an essential resource for those in the financial sector.
Read More
The platform allows users to access a vast array of financial data, including metrics on stocks, ETFs, mutual funds, closed-end funds, indices, and economic indicators. With over 4,000 metrics and 100,000 securities available, YCharts empowers users to conduct thorough research and due diligence. The platform's AI capabilities enhance portfolio analytics, risk assessment, and client management, enabling advisors to create custom proposals and optimize their strategies effectively.
YCharts is designed to drive organic growth and efficiency for large Registered Investment Advisors (RIAs) and wholesalers. It provides intelligent sales tools that help highlight product strategies and generate personalized sales stories. For individual investors and educators, YCharts offers professional-grade tools that support self-guided investing and education.
The platform's features include Quick Extract, which allows users to turn a prospect's statement into a portfolio in seconds, and Risk & Proposal Manager, which connects risk assessment directly to client management workflows. YCharts continuously monitors portfolios, alerting users to rebalancing needs and better-performing alternatives, ensuring that they are always prepared for client conversations.
YCharts also excels in market and position monitoring, providing dashboards that centralize market data and economic indicators. The platform automatically refreshes insights and generates AI market commentary, keeping teams aligned and informed without manual monitoring. With dedicated support and personalized onboarding, YCharts ensures that users can maximize the value of the platform from day one.
In summary, YCharts is more than just a research tool; it is a powerful platform that enhances the capabilities of financial professionals, enabling them to make smarter investment decisions and effectively communicate their strategies to clients.
- CategoryFinancial Analysis Tools
- Pricing ModelSubscription-based
- DeploymentCloud
- PlatformsWeb
YCharts's Core Features
AI-enhanced portfolio analytics
Custom proposals generation
Risk assessment tools
Market monitoring dashboards
Integration with Orion, Redtail, Salesforce, eMoney
Real-time alerts for portfolio changes
Access to 4,000+ financial metrics
Client-ready reports
Dedicated support
Seamless onboarding process
How to use YCharts?
Configure: Set up your YCharts account and customize your dashboard.
Analyze: Use the extensive data tools to conduct financial research.
Build: Create custom model portfolios using Quick Extract.
Engage: Generate proposals and reports for client meetings.
Monitor: Keep track of market changes and portfolio performance.
Collaborate: Share insights and reports with your team.
Optimize: Utilize AI tools for portfolio optimization and risk assessment.
YCharts's Use Cases
- Portfolio Management
- Client Proposals
- Market Analysis
- Risk Assessment
- Sales Enablement