
Description
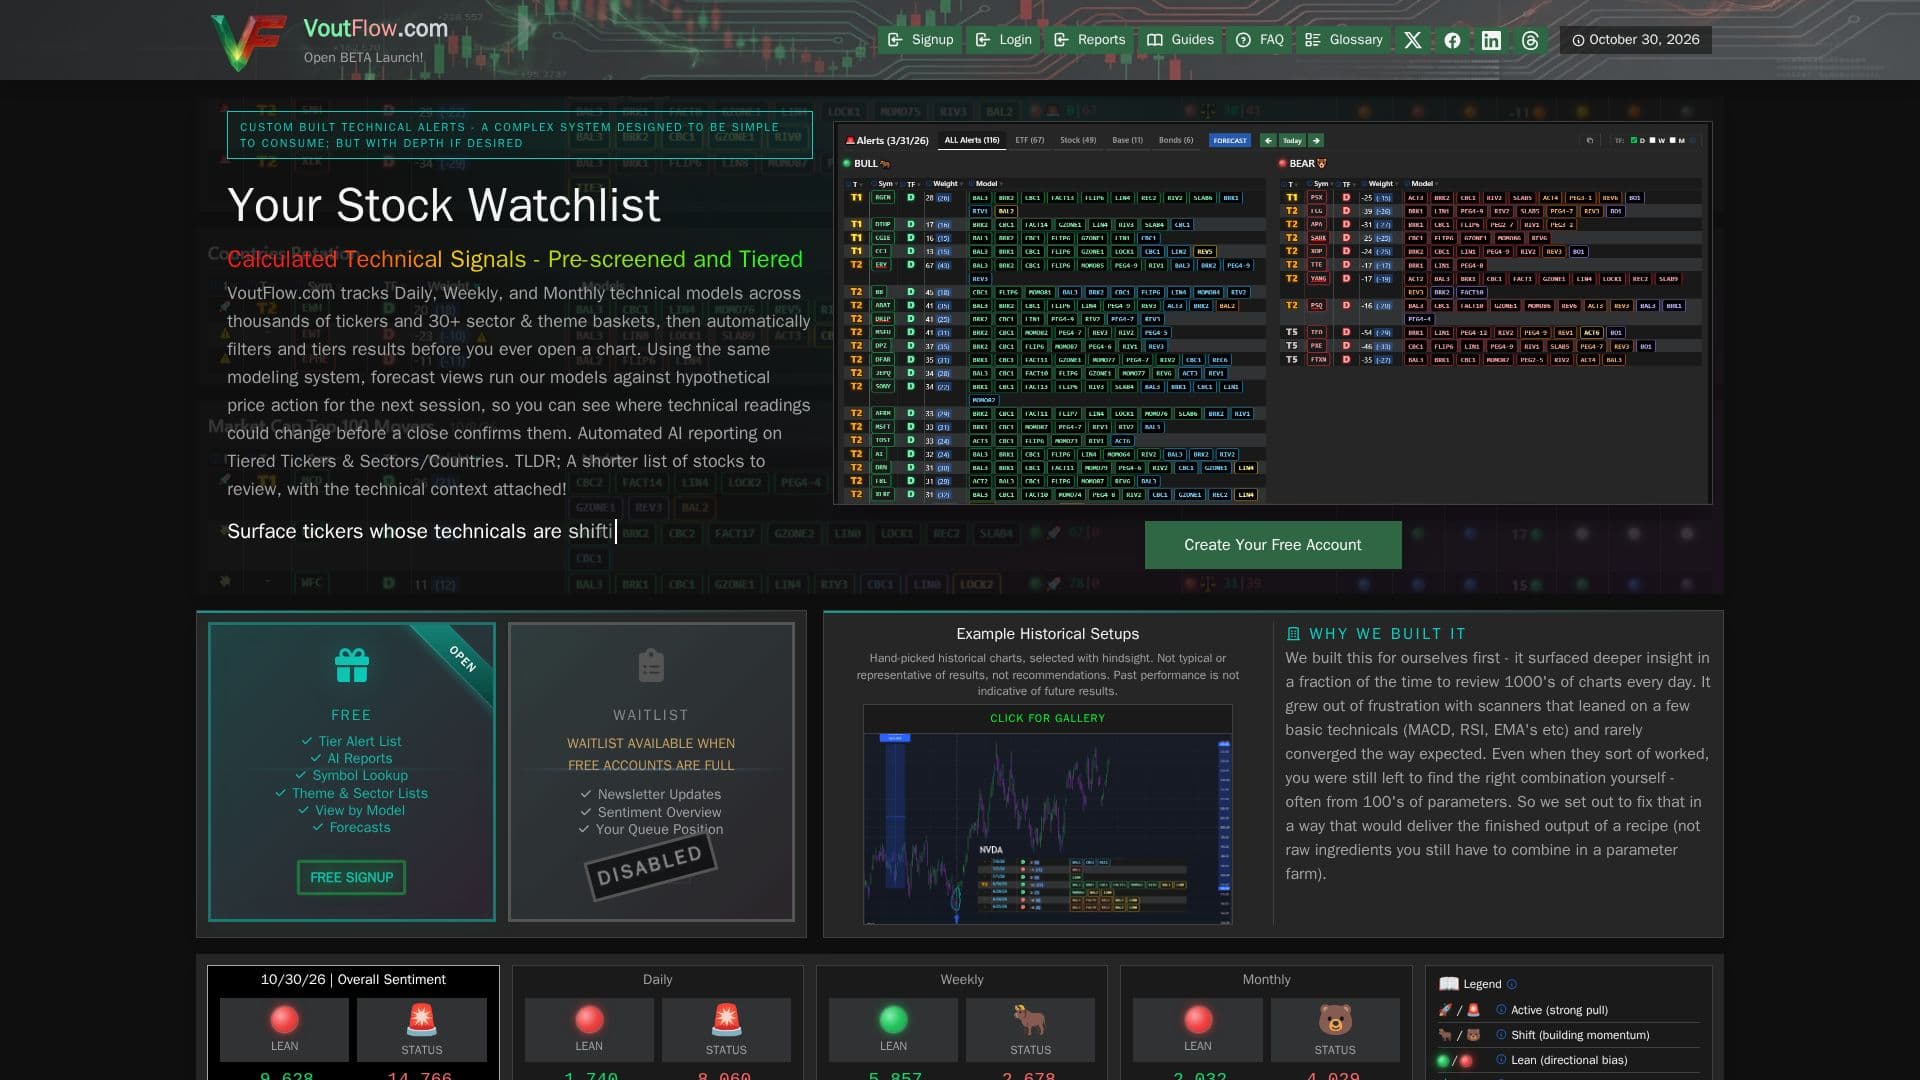
VoutFlow.com offers a sophisticated system for technical stock alerts, designed to simplify the consumption of complex market data. It tracks daily, weekly, and monthly technical models across thousands of tickers and over 30 sector and theme baskets. The system automatically filters and tiers results, presenting users with a pre-screened watchlist before they even open a chart.
Read More
Beyond historical data, VoutFlow provides forecast views by running its models against hypothetical price action for the next session. This allows users to anticipate potential changes in technical readings before they are confirmed by a market close. The platform also includes automated AI reporting on tiered tickers, sectors, and countries, offering a concise list of stocks to review with attached technical context.
The core of VoutFlow's functionality lies in its 20 fine-tuned and carefully weighted models. These models run calculations and trigger alerts, with multiple simultaneous triggers contributing to a final weighting. Sentiment readings at the top of the alerts pages aggregate these weights across tracked tickers, summarizing the broader technical lean of the market. Tiers apply a second screening layer of technical checkpoints, ensuring that only qualified tickers are presented, without arbitrarily capping results.
VoutFlow is built to surface technical shifts as they develop in the data, aiming to provide insights before moves become obvious on a chart. It is particularly suited for swing traders who actively manage a portfolio and investors looking to gauge technical quality before making an entry. The alerts are calculated on daily, weekly, and monthly timeframes, making it less suitable for intraday day trading.
Key features include live alerts processed from end-of-day data, multi-timeframe weighting that combines daily, weekly, and monthly insights, and tiered alerts (T1 being the strictest, T5 being looser but with higher weight requirements). Users can also view individual models categorized by style (Momentum Shifts, Trend Reversals, Mean Reversion/Exhaustion, Breakouts/Breakdowns, Support/Resistance), perform symbol deep-dives for comprehensive historical data, and review themes and sectors like semiconductors, cryptocurrency, or core sectors as baskets. The sentiment lean feature provides a quick summary of current weighted technical readings, categorized as Active, Shifting, Leaning, Neutral, or on Pause.
- CategoryAI Trading & Investing Tools
- Pricing ModelFreemium
- DeploymentCloud
- PlatformsWeb
VoutFlow's Core Features
Daily Technical Stock Alerts
20 Weighted Multi-Timeframe Models
Pre-screened & Tiered Watchlists
Covers 2,500+ Tickers, Sectors & Themes
Automated AI Reporting
Forecast Views for Hypothetical Price Action
Multi-Timeframe Weighting (Daily, Weekly, Monthly)
Tiered Alert System (T1-T5)
Model-by-Model View (Momentum, Trend, Reversion, Breakouts, Support/Resistance)
Symbol Deep-Dives with Sentiment History
Theme & Sector Basket Analysis
Sentiment Lean Summary (Active, Shift, Lean, Neutral, Pause)
Historical Setups for Review
No Stock Screener Configuration Needed
Designed for Swing Traders and Investors
How to use VoutFlow?
Access Alerts: Log in to view daily end-of-day technical stock alerts.
Review Watchlist: Examine the pre-screened and tiered list of tickers.
Utilize Forecasts: Check hypothetical price action to anticipate technical changes.
Analyze Sentiment: Use the aggregated sentiment overview for broader market lean.
Filter by Tier: Focus on setups matching your criteria using the tiered alert system.
Explore Models: View individual models based on your preferred trading style.
Deep Dive Symbols: Get detailed technical history and model triggers for specific tickers.
Monitor Themes/Sectors: Review performance and technical readings across various baskets.
VoutFlow's Use Cases
- Daily Stock Watchlist Creation
- Technical Signal Identification
- Pre-Market Analysis
- Swing Trading Strategy
- Investment Entry Gauging
- Sector & Theme Rotation Analysis
- Multi-Timeframe Confluence
- Reducing Chart Review Time
- Understanding Market Lean