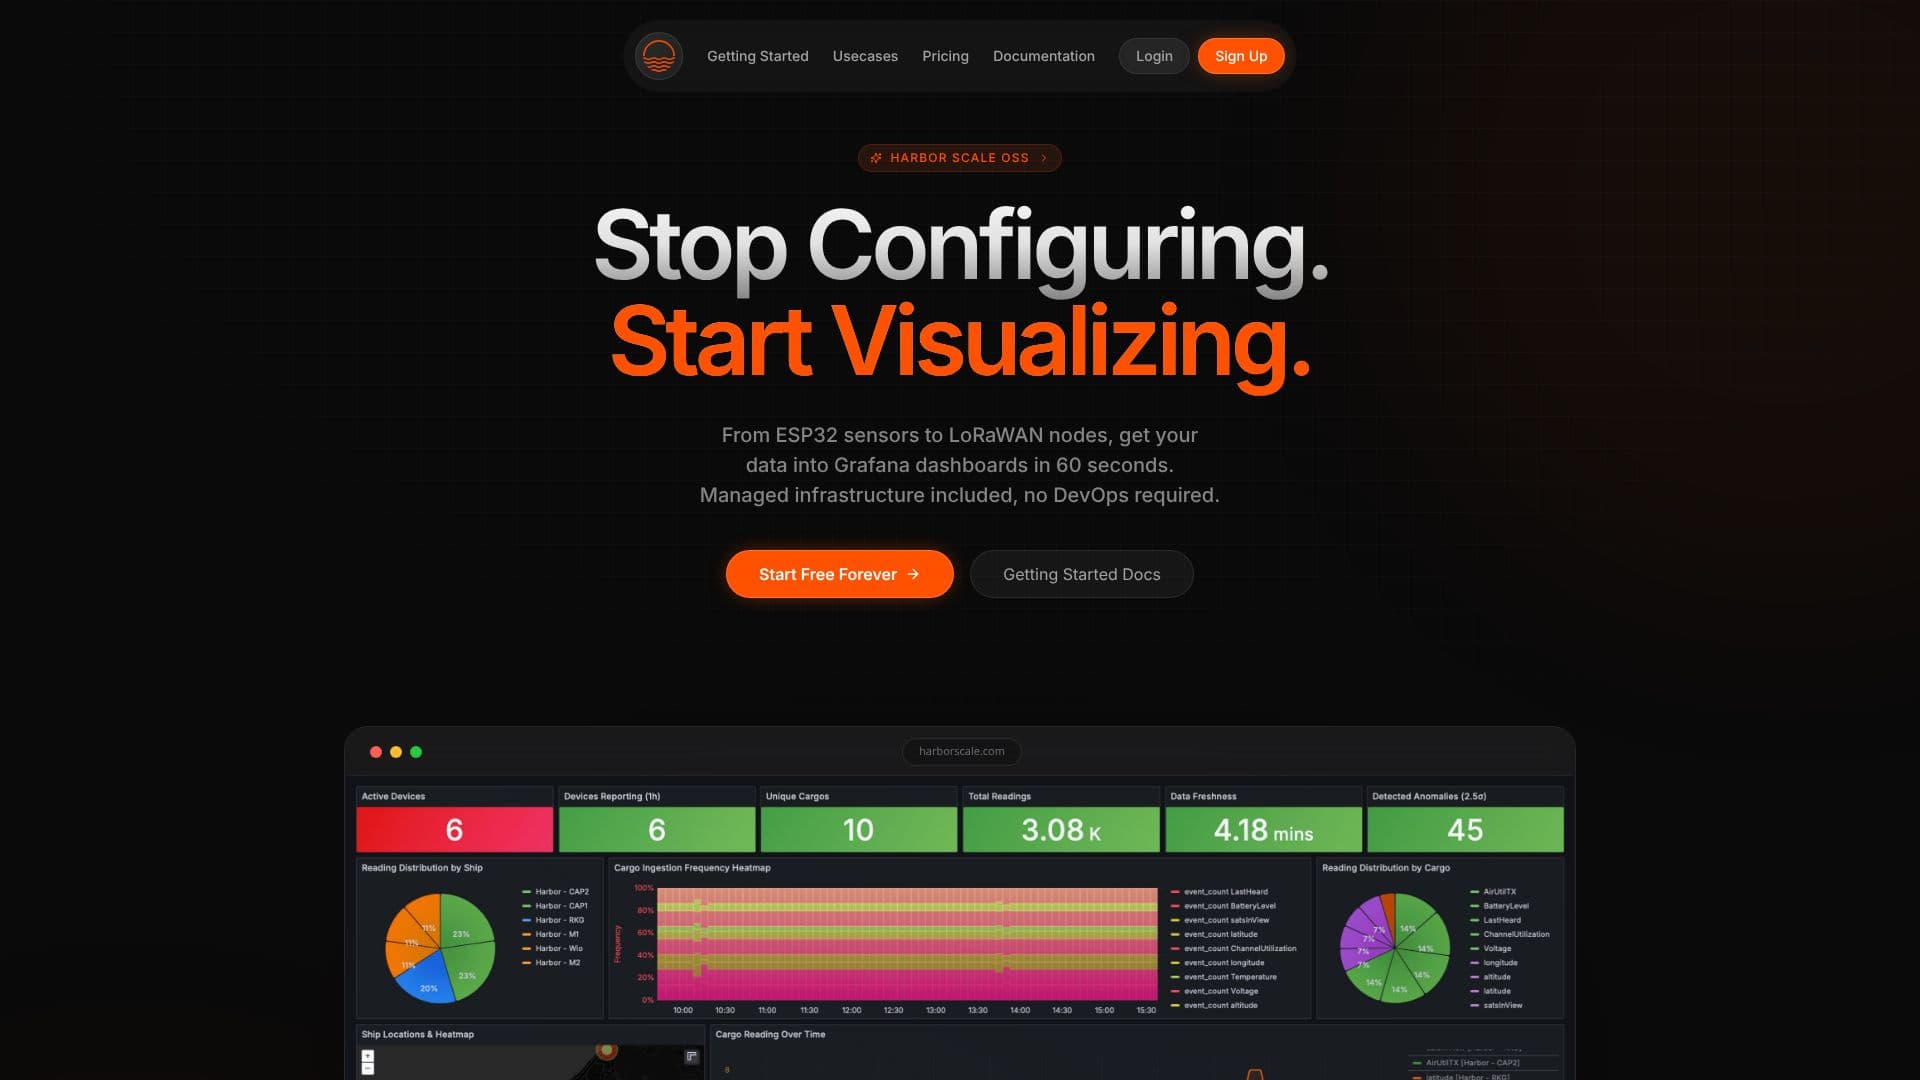
Description
Harbor Scale is designed to eliminate the time-consuming process of setting up and managing monitoring infrastructure for IoT devices and servers. Instead of spending hours configuring Grafana and InfluxDB, users can get their data visualized in managed Grafana dashboards within 60 seconds. This service is particularly beneficial for developers working with ESP32, Arduino, and LoRaWAN devices, as well as for monitoring Linux servers, Docker containers, and edge devices.
Read More
The platform emphasizes a 'stop configuring, start visualizing' approach. It offers a significantly faster setup time compared to DIY solutions, reducing setup from hours to seconds. Harbor Scale also provides extended data retention, offering 180 days of history compared to the 14 days often found in DIY setups, and a more cost-effective solution with a flat monthly rate versus potentially high cloud bills.
Harbor Scale simplifies the process with a single command to install an agent that automatically detects running services and system metrics, eliminating the need for configuration files. Upon login, users find their Grafana workspace already provisioned with dashboards and their data flowing in. It supports native collectors for Linux, Docker, and Systemd services, and can ingest data from a wide range of IoT devices and custom applications.
A key innovation is Harbor AI, a personal data analyst that allows users to query data using plain English. It can perform complex analyses like K-Means clustering and linear regressions, generate visualizations such as charts and heatmaps, and provide full transparency by showing the exact queries used. Harbor AI also offers anomaly detection and forecasting, proactively identifying potential issues and trends before they impact operations.
The platform boasts a 'copy-paste integration' with just a few lines of code required to start streaming data from devices. It supports a broad ecosystem of hardware and software, including ESP32, Arduino, Python, MicroPython, C++, Linux, Docker, Node.js, and various LoRaWAN solutions like The Things Network. This extensive compatibility ensures that users can integrate Harbor Scale with their existing technology stack seamlessly.
- CategoryAI Data Analysis
- Pricing ModelFreemium
- DeploymentCloud
- PlatformsESP32, Arduino, LoRaWAN, Linux, Docker, Windows
Harbor Scale's Core Features
Managed Grafana dashboards
60-second setup for IoT data visualization
Free tier available
No credit card required for free tier
Zero-configuration agent for servers and edge devices
Automated service and system metric detection
180-day data retention
Harbor AI for natural language data querying
AI-powered anomaly detection and forecasting
AI-generated visualizations
Support for ESP32, Arduino, LoRaWAN, Linux, Docker
Copy-paste integration with SDKs
Real-time data ingestion
Unified interface for diverse data sources
How to use Harbor Scale?
Install Agent: Deploy the agent on your server or IoT device with a single command.
Name Source: Assign a name to your data source.
Stream Data: Data begins flowing to your managed Grafana dashboard automatically.
Visualize Data: Access pre-provisioned Grafana dashboards to analyze your real-time data.
Query with AI: Use Harbor AI to ask questions about your data in plain English.
Analyze Trends: Leverage AI for anomaly detection, forecasting, and generative visualizations.
Harbor Scale's Use Cases
- IoT Data Visualization
- Server Monitoring
- Embedded Systems Analytics
- Anomaly Detection
- Predictive Maintenance
- Data Exploration
- Fleet Management
- Smart Home Monitoring