
Description
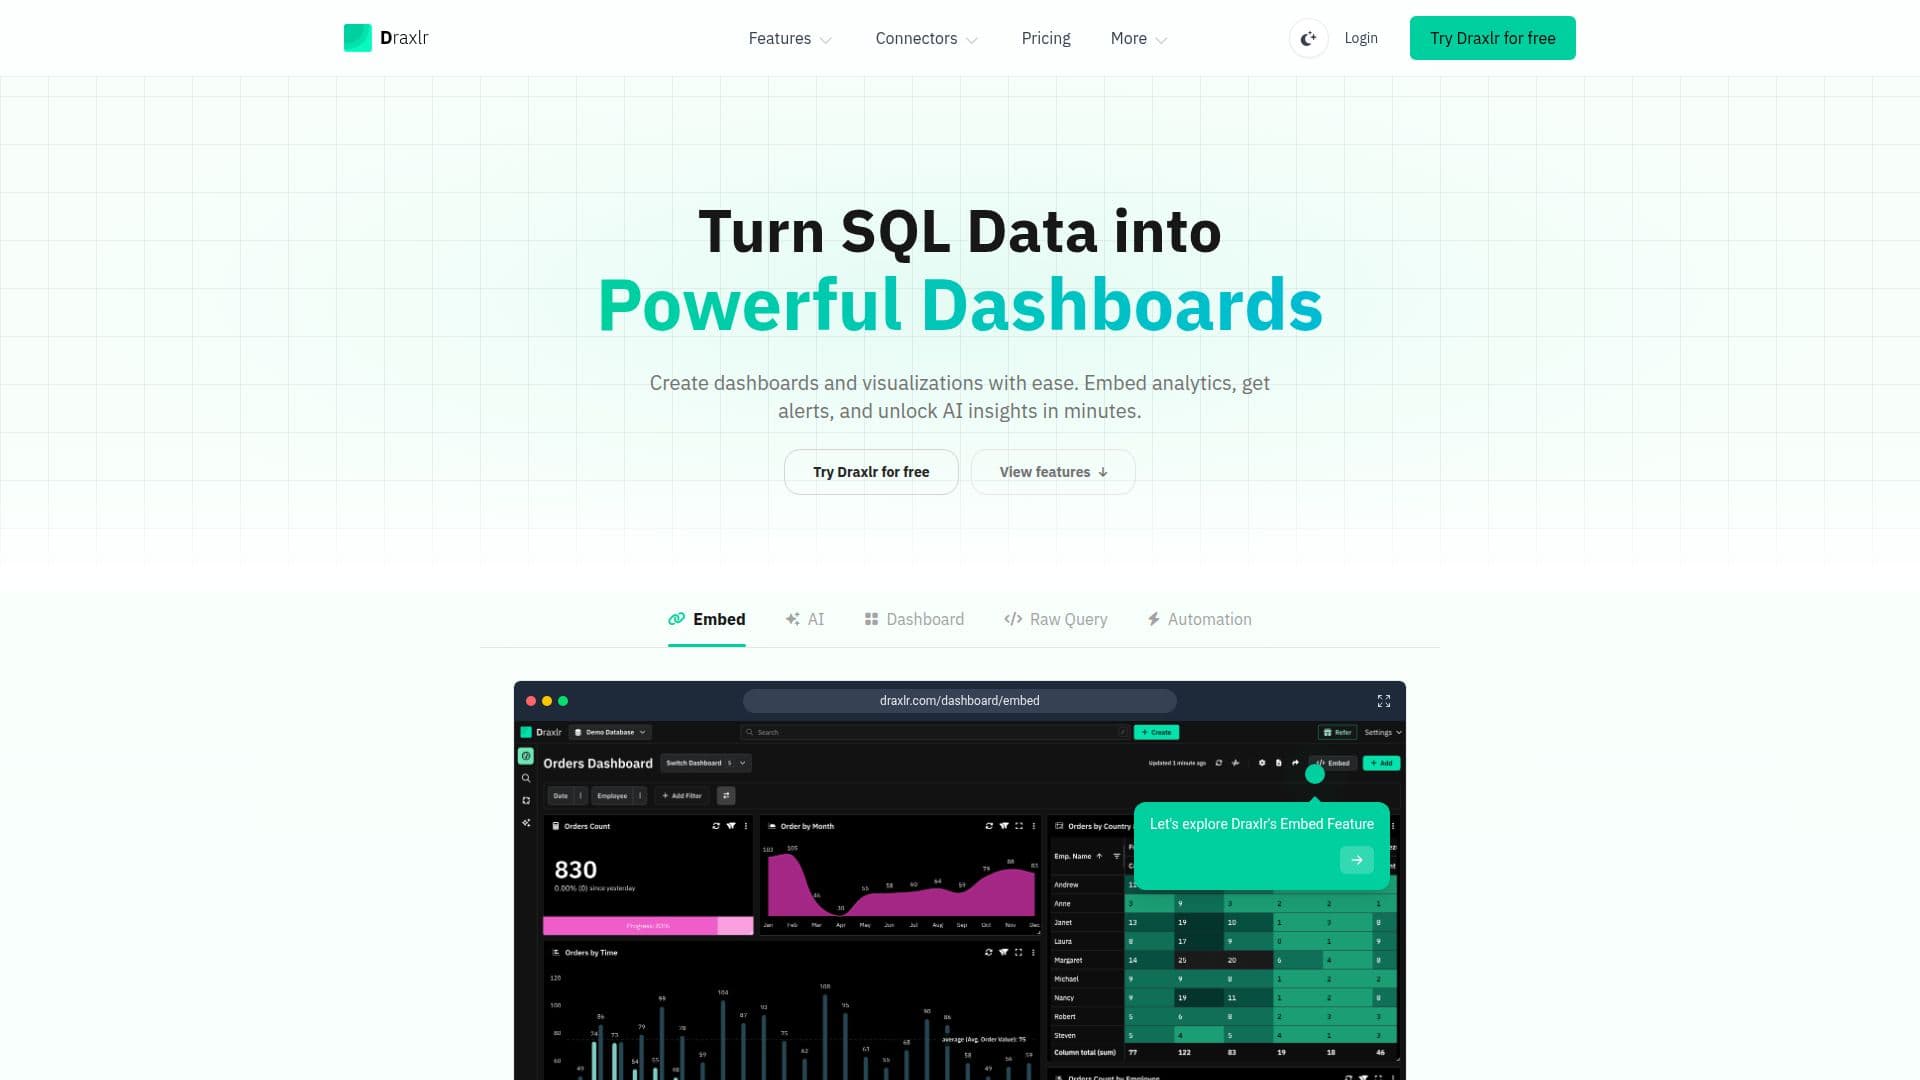
Draxlr is a self-service business intelligence platform designed to help teams connect to their SQL databases, build dashboards, and share insights without the need for complex setups. With Draxlr, users can easily create dashboards and visualizations, embed analytics, and set up alerts on their SQL databases, making it a powerful tool for data-driven decision-making.
Read More
The platform allows users to connect multiple SQL databases, including popular options like PostgreSQL, MySQL, Microsoft SQL Server, and Snowflake. Once connected, users can filter, sort, and summarize their data, joining information from various tables to create comprehensive visualizations. Draxlr's intuitive interface enables users to build and share dashboards quickly, providing real-time insights that can be monitored across multiple dashboards.
Draxlr also integrates AI capabilities, allowing users to connect AI assistants like Claude and Cursor to their databases. This feature enables users to ask questions in plain English, run queries, and generate dashboards with ease. The platform emphasizes security, ensuring that user data is never stored and that all connections are secure. Users can also self-host Draxlr to maintain complete control over their data.
With pricing starting at $75 per month, Draxlr offers a 7-day free trial of its Premium plan, allowing potential users to explore its features without any upfront commitment. The platform is suitable for a wide range of users, from startups to large enterprises, and is designed to make analytics accessible to everyone, regardless of their technical background.
- CategoryBusiness Intelligence
- Pricing ModelSubscription
- DeploymentCloud, Self-hosted
- PlatformsWeb
Draxlr's Core Features
No-code dashboard creation
AI SQL assistant
Real-time data alerts
Multiple database connections
Data visualization tools
Embed dashboards in applications
Self-hosting option available
Secure data connections
Export options for CSV, Excel, PDF
Role-based access control
How to use Draxlr?
Connect with your SQL database: Sign up on Draxlr and connect it to your database.
Build queries: Filter, sort, and summarize your data using the visual query builder.
Create dashboards: Use the dashboard builder to visualize your data and insights.
Set up alerts: Configure data alerts to notify you of important changes.
Embed dashboards: Integrate your dashboards into your web applications.
Collaborate with your team: Share dashboards and insights with team members.
Utilize AI: Connect AI assistants to query your database and generate insights.
Export your data: Download dashboards and data visuals in various formats.
Draxlr's Use Cases
- Data Visualization
- Real-time Analytics
- AI Integration
- Team Collaboration
- Self-hosting